Health, Concussion
Welcome and thanks for visiting...

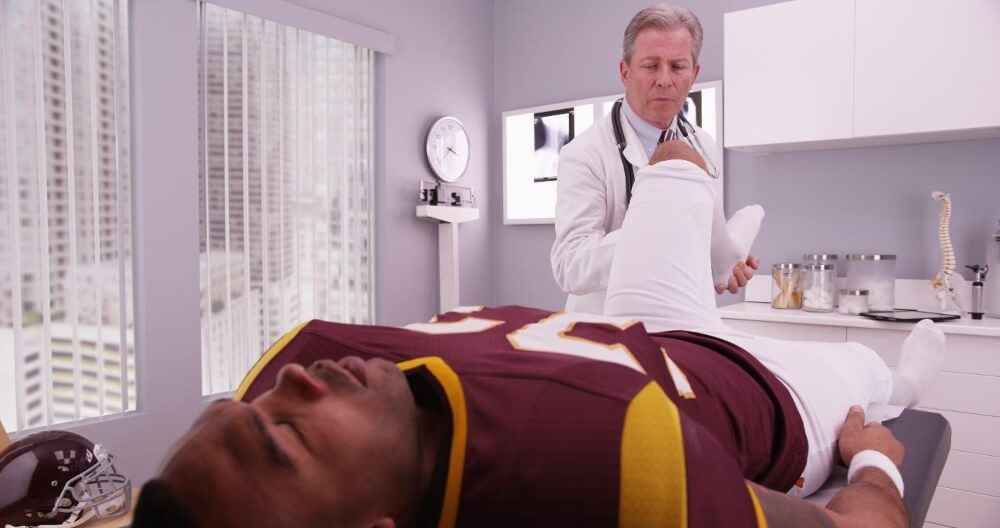
Does Previous Concussion Put You at Risk for Injury? - Part III


During our last blog, we talked about the latest research related to concussion and lower limb injuries. We also know, from our previous two weeks of looking at the research that there is an impact on future athletic performance. I am a firm believer that if we can identify why this is the case, then we can develop some kind of training to address it, reduce risk for injury and improve performance. That said, we have been collecting mass movement data on athletes since 2016 and now have over 1000 data points per athlete on over 20,000 athletes. The beauty of this is that it is allowing us to see some correlations prior to what is being published in the research. This allows us to identify and create ways to address prior to most even being aware of what these correlations are. This is groundbreaking stuff here and I would encourage all who deal with athletes who have had a concussion to consider what we are learning and start implementing this into your training today. Why wait another 5 years for this to be published when we can impact our athletes today!
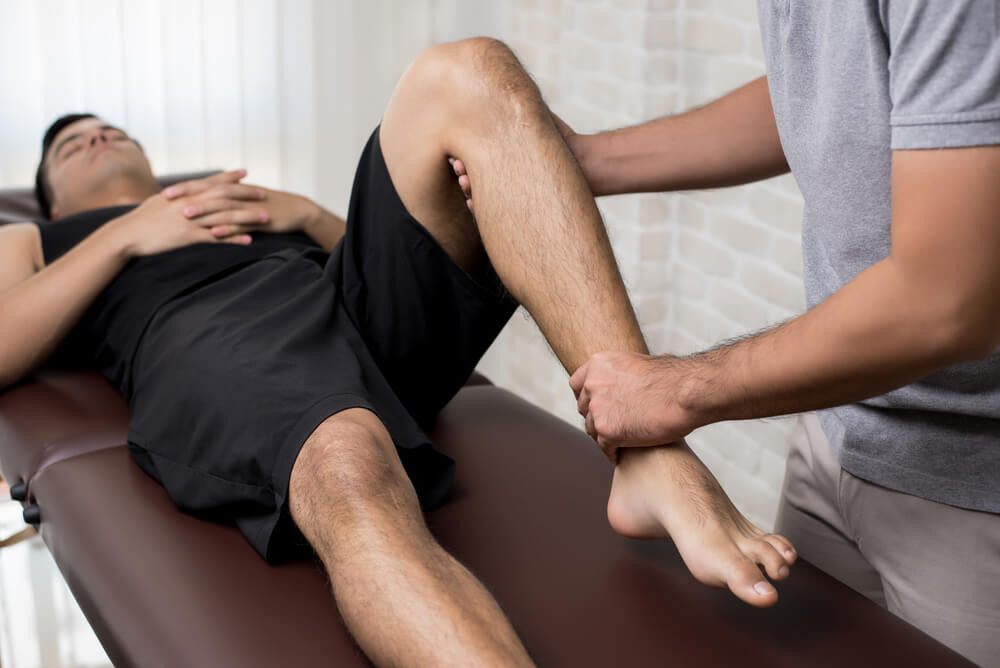
Most of what we see, when we compare our concussed athletes to our non-concussed athletes is a significant difference when we test them in single-leg stability. There are several things that we look for in testing single-limb stability which we will dive into in a moment. One thing to consider is we do not see a difference in what we call or term limb symmetry index or LSI. LSI is the difference between your right and left limb during testing. It is commonly used for comparison purposes and if greater than 10% difference can indicate a bigger risk. However, with the concussed, the impact you see impacts both limbs equally. So you don’t typically see a huge variance right side to the left side as a result of the concussion. They may have had a variance in LSI prior to concussion but the concussion does not appear to make that variance larger.
All that considered, one of the things we notice is an increase in time to stability or TTS. Time to stability is how much time it takes an athlete to get stable after performing a single leg hop. We have all seen the athlete who, when jumping during a single leg hop, land, can’t get stable and end up bouncing all over the place. The longer it takes them to get stable on one leg without supporting with the opposite limb, the more likely they are to get injured. How we measure this is we ask the athlete to perform a single leg explosive hop. When they land for the first time, we get a timestamp and the clock starts running. Time to stability is the amount of time from landing to the time where they are finally stable and stop moving around. Studies (Pappas et al Clin J Sport Med 2011) have shown that the longer it takes to get stable, the more susceptible you are to ankle and lower leg injuries. What we have seen is when we compare athletes with a history of concussion with those without a history of concussion, that athletes who have had a concussion have significantly higher TTS. As a coach, athletic trainer or physical therapist, this is now something we can look for and test in our athletes post-concussion as they prepare to return to sport.
Another thing that we see, and which can be easily measured and most likely associated with TTS, is surface area covered. How you measure this is by creating a circle like what is depicted here. Using a string that is 24 inches long anchor it on one end. On the other end, using a marker (or tape) draw a circle like is depicted here. You can then shorten the string by one inch and repeat. What this will do is create a circle with one-inch measures from the center point. If you have your athlete stand in the center and perform repetitive single leg hops, you can get an objective measure of the distance they cover from the starting position. Each landing results in a measurable point. After 10 hops, these measurable points become a scatter plot (like depicted here). What we have found is that the wider the scatter plot, the more likely the athlete is to suffer a lower limb injury. The closer or tighter the scatter plot is, the less likely they are to suffer an injury. What we see with concussed athletes when compared to non-concussed athletes is that their scatter plots are much bigger and spaced much further apart. Often, ending outside the circle. Again, as a coach, athletic trainer or physical therapist, this gives us something else we can test prior to return to sport.

We have talked about two specific things we see, but these are not the most significant ones. Next week we will continue to dive into this and look at specific movement-related deviations we see. The idea with all this discussion is to provide you with the knowledge that this exists, an understanding of how we can assess this on the field and how we can create exercise programs to address. I hope you find this useful and Stay Tuned!
Does Previous Concussion Put You at Risk for Injury? - Part I
Does Previous Concussion Put You at Risk for Injury? - Part II
Does Previous Concussion Put You at Risk for Injury? - Part IV
Does Previous Concussion Put You at Risk for Injury? - Part V