Running / Technology / Kinesiology
By Anton Galvas, Senior Contributor
Clinical review by Subhashree Easaki, physiotherapist
Smartphone gait reports can be genuinely useful, but not every number deserves the same level of trust. Here is how to tell measurements from estimates, film a video that produces usable data, and read a report like a coach rather than a scoreboard.
A few years ago, seeing your own running or walking mechanics meant booking time in a motion-capture lab: reflective markers on the skin, a ring of infrared cameras, force plates in the floor, and an analyst to turn it all into a report. Today a phone on a tripod and a minute of processing can produce a report with thirty or forty numbers, joint-angle curves and color-coded zones.
That is real progress for coaches, athletes and parents who will never have a lab down the hall. It is also a new way to be misled. A single camera records a flat picture of a three-dimensional body. Some of what a report shows is measured directly from that picture, some is estimated by a model, and some cannot be seen at all. Yet all of it tends to be printed in the same font, to one decimal place, with the same apparent confidence.
This article is a practical guide to telling those apart. The examples come from real reports produced by AiKYNETIX, the markerless analysis platform I co-founded, including several that show the method at its limits. The principles apply to any 2D video system, and to video you review by eye.

What "2D" actually means
A camera sees the world like a photograph: up and down, left and right, with very little sense of depth. Biomechanists describe human movement in three planes:
• The sagittal plane holds forward and backward motion, seen from the side: knee bend, ankle angle, hip flexion and extension, forward trunk lean, how the foot meets the ground.
• The frontal plane holds side-to-side motion, seen from the front or back: the pelvis dropping on one side, knees moving in or out, step width, leaning sideways.
• The transverse plane holds rotation, best seen from above: the thigh and shin turning inward, the pelvis and shoulders twisting against each other.
One camera captures one plane well. A camera at the side of the track sees the sagittal plane. A camera directly behind the athlete sees the frontal plane. No ordinary camera position sees rotation directly. Almost everything that follows in this article follows from that single fact.
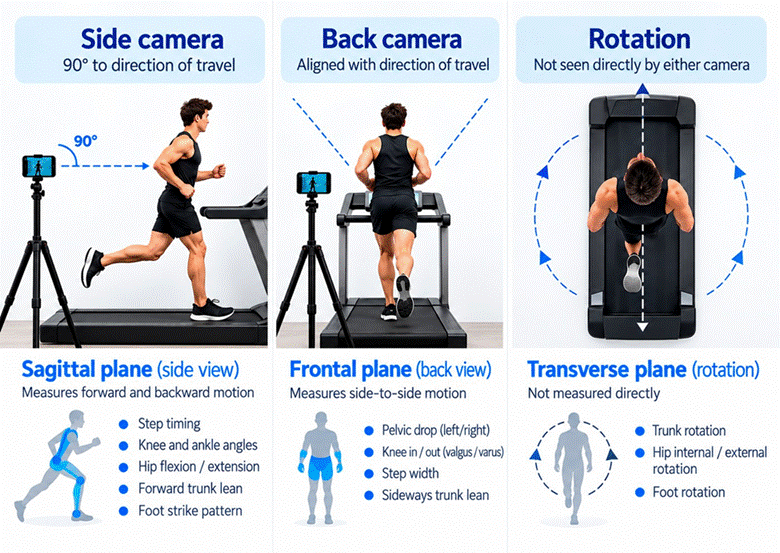
Figure 1. Seen from above: each camera position "owns" one plane of motion. Rotation is not directly visible to either.
What 2D video does well
Timing: the most dependable numbers in the report
Cadence, step time, ground contact time, flight time, and left-right timing balance all come down to one question: in which frame does the foot land, and in which frame does it leave the ground? Answering that requires no depth perception, which is why timing metrics are usually the most trustworthy part of any video report.
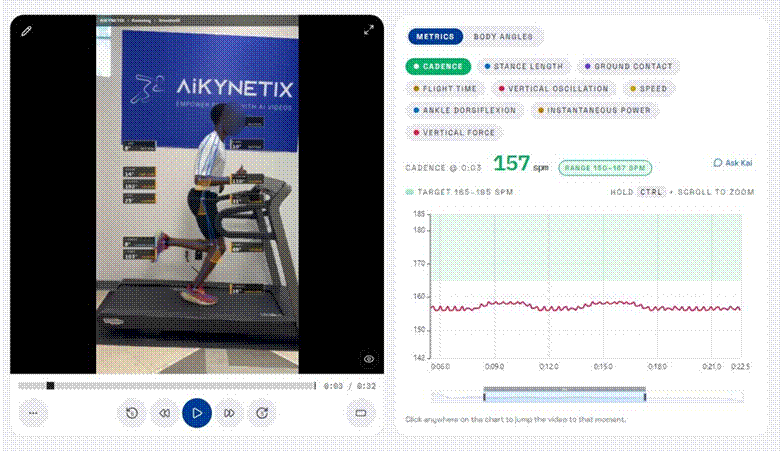
Figure 2. A treadmill run filmed side-on. The tracked skeleton is overlaid on the video and the cadence curve on the right is plotted stride by stride. A flat, repeating curve like this one is what steady-state data should look like.
Timing has one built-in limit, and it is simple arithmetic. At 30 frames per second, the frames are 33 milliseconds apart, so a contact time can be off by up to one frame at touchdown and another at toe-off. At 60 frames per second, the gap halves to about 17 milliseconds. If you compare contact times between sessions, film at the same frame rate each time, and treat a difference of a single frame as noise rather than progress.
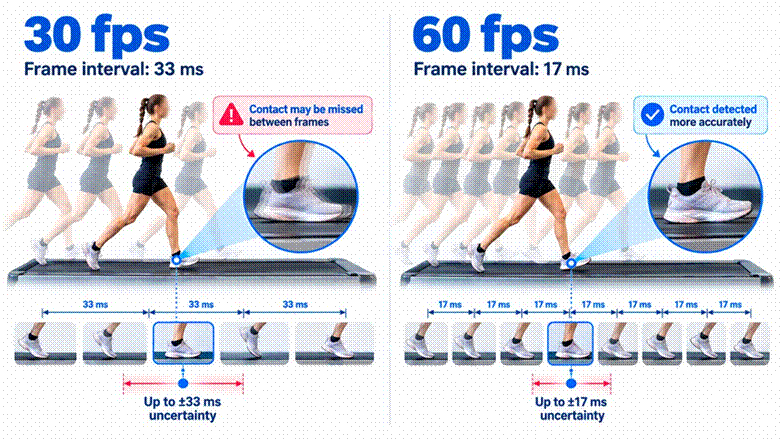
Figure 3. The camera only "sees" the foot in individual frames, so touchdown and toe-off can each be missed by up to one frame interval. Doubling the frame rate halves that uncertainty.
Joint angles from a true side view
Side-view angles are the second strength. When the camera is level and 90 degrees to the direction of travel, knee flexion at contact, peak knee bend during stance, ankle angle at contact, shin angle, and forward trunk lean all lie close to the camera's plane. A 2023 systematic review and meta-analysis comparing 2D video with 3D motion capture during running found low-to-moderate agreement for most angles, but knee flexion during stance and sagittal ankle angles at initial contact stood out as the most valid.2,5 Automated tracking studies show a similar picture for walking: pose estimation from ordinary video can detect changes in sagittal gait in healthy adults with useful accuracy.1
Because the side view captures timing and angles together, it is also the right view for breaking a stride into phases and asking what each joint is doing in each one. This is often more useful to a coach than any single number. For example, it shows whether a long ground contact comes from a foot landing far ahead of the hips or from a slow, sinking mid-stance, and those two problems call for different cues.8
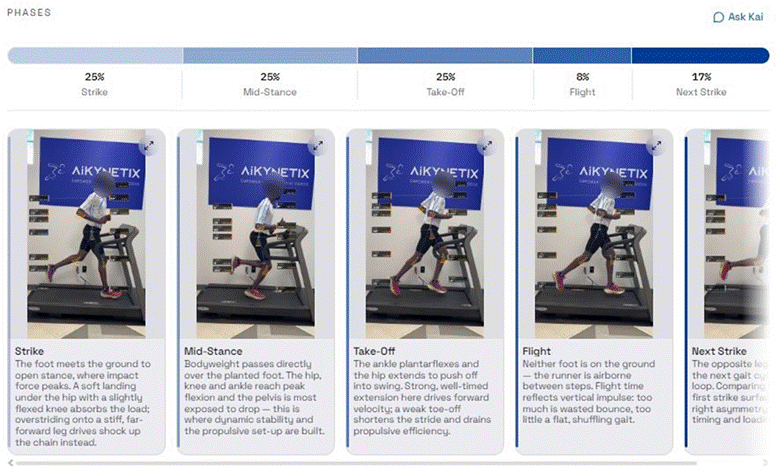
Figure 4. One running stride divided into phases, each with its own video frame. Reading joint angles phase by phase turns a list of numbers into a description of movement.
Change over time for the same athlete
Two different questions hide inside "is video accurate?" Validity asks whether video gives the same value as a lab. Reliability asks whether it gives the same value twice. For 2D running analysis, reviews rate reliability as generally moderate to excellent, while validity against 3D capture varies much more.2,4 That points directly to the best use of the method: comparing an athlete with themselves, filmed the same way, at the same speed, over weeks and months. If a knee angle reads a few degrees off the lab value, it will tend to read a few degrees off every time, so a change between sessions can still be real even when the absolute number is approximate.
Where 2D video needs caution
Frontal-plane measures from behind
A camera behind the athlete shows pelvic drop, knee travel relative to the foot, step width, and sideways trunk lean. These are some of the most discussed features of running and walking, and video is a practical way to see them. But the frontal plane is harder to capture with a single camera than the sagittal plane. The motions are small, often only a few degrees. The landmarks are partly hidden: the hip joint sits under muscle and soft tissue. Any rotation of the thigh or pelvis can leak into what looks like a frontal-plane angle. Reviews of studies comparing 2D and 3D methods advise particular caution with frontal-plane and rotational angles.2,7
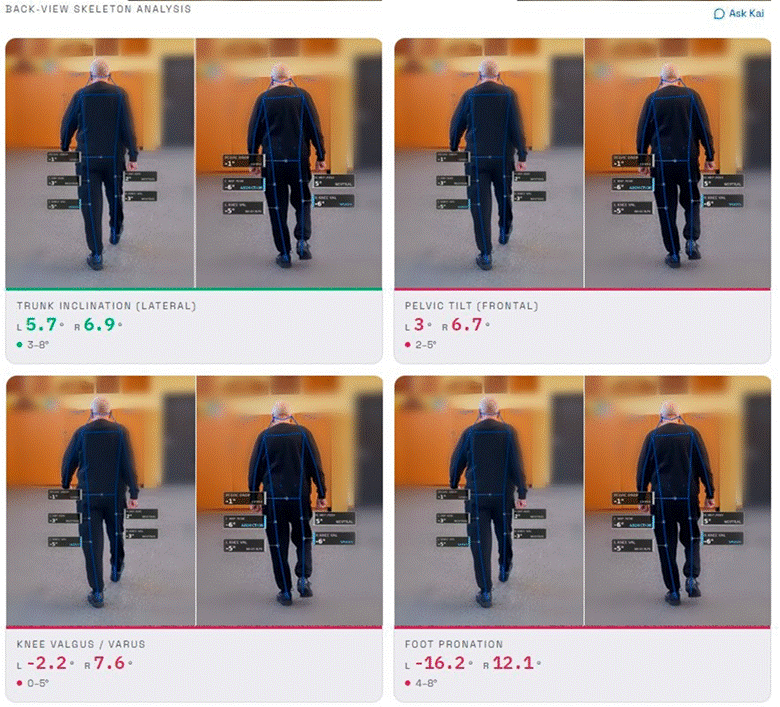
Figure 5. A back-view walking analysis pairs left and right stance frames for four frontal-plane measures. The feet, the smallest segments in the frame, are where tracking is least certain.
The honest way to present these values is the way our own reference guide describes pelvic drop:
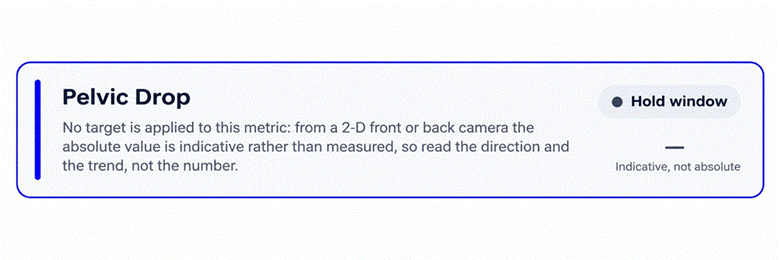
Figure 6. From a report's reference guide: frontal-plane values from one camera are indicative. Read the direction and the trend.
In practice, that means asking two questions rather than one. Does the pelvis drop more on one side than the other? And is that difference shrinking, growing, or holding steady as training, fatigue, or footwear change? Both questions survive a few degrees of measurement error. A single absolute number usually does not.
Small body segments at a distance
The smaller a body segment is in the frame, the fewer pixels describe it and the larger the error becomes. A rearfoot angle has to be calculated from a heel that may be only a few dozen pixels wide when the athlete is several meters from the camera. In the walking report below, the left foot reads 16 degrees of supination and the right foot 12 degrees of pronation in the same short clip. That could be a genuine asymmetry. It could equally be a tracking artifact from a walker moving away from the lens and shrinking with every step. Before acting on a value like this, check the video, film again closer and at a constant distance, and see whether the pattern repeats.
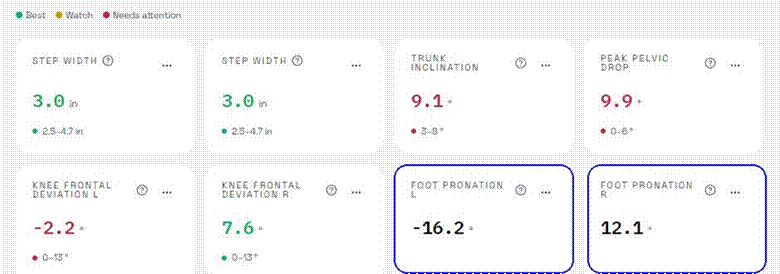
Figure 7. Large opposite readings for the two feet in one six-second clip. The pelvis and trunk values are worth discussing; the foot values need a repeat recording before anyone draws conclusions.
Each camera view measures different things
Because a camera behind the athlete cannot see forward motion well, it cannot reliably measure speed, stride length, knee bend, or contact time. A well-designed report leaves those fields empty rather than guessing. If you need both sets of measures, you need both views, recorded as two separate clips, rather than one camera at 45 degrees trying to do both jobs and doing neither well.
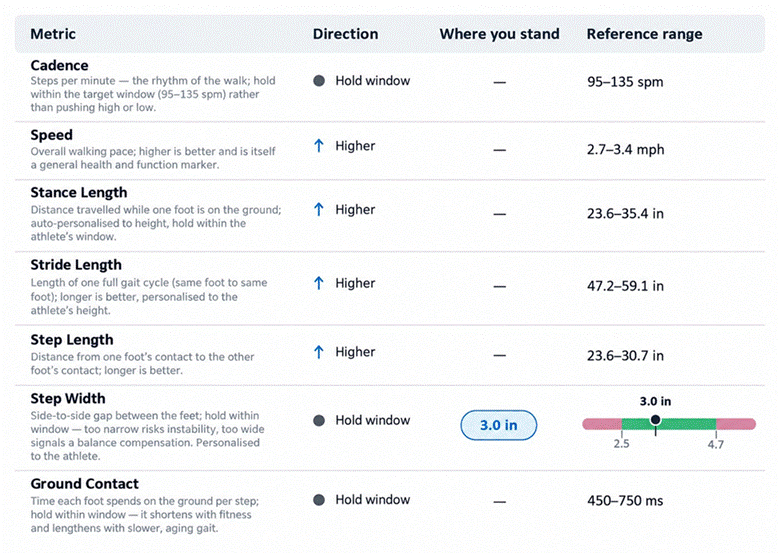
Figure 8. In a back-view walking report, cadence, speed, stride and contact time are deliberately left blank. Only step width, a frontal-plane measure, is reported.
Forces and power are estimates
Some reports show ground reaction force, power in watts per kilogram or loading values. A camera cannot measure force. These numbers come from models that combine the athlete's body mass with how their body and limbs move between frames. Research shows that step rate and sagittal kinematics from a single camera can reasonably estimate ground reaction force during treadmill running,6 making these values useful for trends and comparisons. They are not the same as data from a force plate or an instrumented treadmill. Treat them as estimates that complement those tools rather than replace them.
What 2D video cannot tell you
Rotation
Many running and walking problems are discussed in terms of rotation: the thigh turning inward during stance, the shin rotating as the foot rolls in, the pelvis twisting. A single camera cannot see these motions directly. At best, it sees their shadow projected into another plane. Researchers who validate 2D methods describe horizontal-plane motion as extremely difficult to capture from video.2,7 If a question depends on rotation, it needs 3D capture, multiple synchronized cameras, or a hands-on assessment.
Why a pattern happens
Video shows what the body does, not why it does it. A pelvis that drops nine degrees on one side may reflect weak hip abductors. It may also reflect fatigue, pain, leg length differences, footwear, an old habit, or a comfortable strategy that has never caused a problem. The same goes for long ground contact, a crossover step, or a stiff knee. The video narrows the question. A strength test, a conversation about training load and history, and an experienced coach's eye are what answer it.
A diagnosis or an injury forecast
Gait features associated with injury across a research group don't predict who, in particular, will get hurt. Some platforms, ours included, show a priority or risk score to help you decide what to look at first. Treat it as a flag for attention, not a diagnosis. Smartphone gait analysis is not a medical device. If an athlete has pain, swelling, numbness, or a limp, the next step is a qualified clinician, not another video.
Whether a number is "bad" for this athlete
Every coloured zone in a report depends on a reference range, and every reference range was built from some group of people moving at some speed. Gait changes with speed, age, height, experience, and surface. As running speed drops, ground contact gets longer, and cadence usually falls. In the report below, a contact time of 288 milliseconds and a cadence of 157 steps per minute are flagged against general ranges, but the runner is moving at 5.9 miles per hour, a 10:08 mile. At an easy pace like that, both values are far less surprising than the red markers suggest.
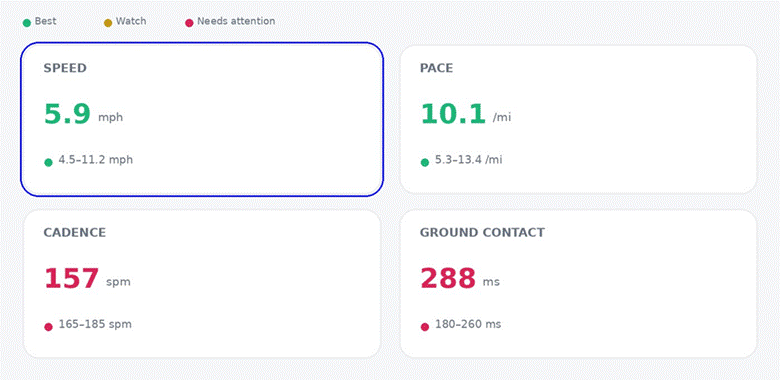
Figure 9. Cadence and contact time are flagged, but start with the speed card. Read every out-of-range value next to the speed it was recorded at.
Before "fixing" a number, check that the reference range fits the athlete in front of you. A good platform lets a coach adjust the thresholds, and a good coach should feel free to disagree with them.

Five filming mistakes that quietly ruin the data
Most bad gait data is not caused by the software. It is recorded into the video before the analysis begins.
A camera that is not square to the path
If the camera looks at the athlete at an angle, joint angles are foreshortened. Because that viewing angle changes as the athlete moves across the frame, the error changes too. The tell-tale sign is a curve that drifts steadily up or down instead of repeating with each stride.
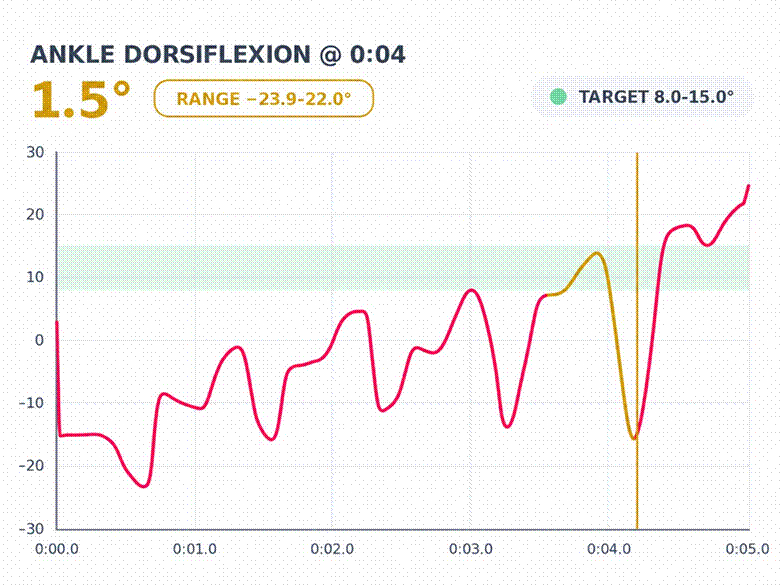
Figure 10. An ankle angle that should repeat every stride instead climbs steadily across five seconds. That shape points to the camera setup, not the ankle.
A clip that is too short, or that includes starting and stopping
Walking past a camera for five seconds captures two or three strides per leg, plus the slowdown at the end. In the trace below, cadence holds steady and then falls sharply in the final second and a half as the walker slows and leaves the frame. The same clip reported a 20 percent left-right difference in contact time, and with so few steps one unusual stride can produce that on its own. One test-retest study found that a 2D average needs at least seven steps to settle.3 Aim for about 30 seconds of continuous running, and close to a minute of walking, ideally on a treadmill or a long straight path, and leave the start and finish out of the analysis.
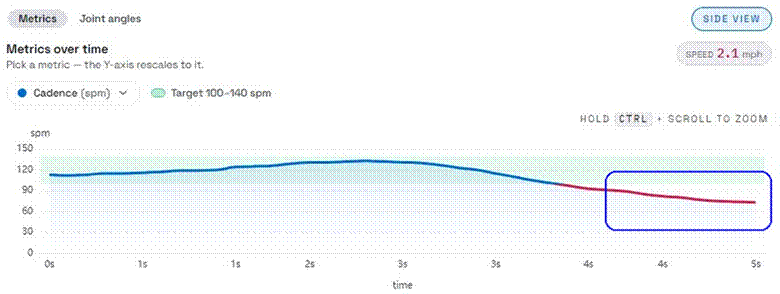
Figure 11. The last part of a short walking clip. The drop at the end is the walker slowing down, not a change in their gait, and it pulls every average with it.
The wrong height or a tilted lens
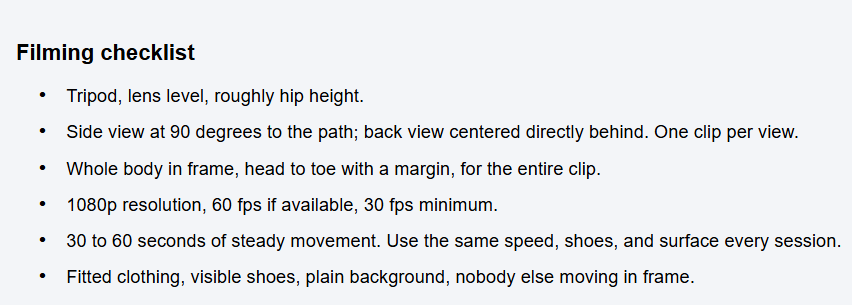
A phone held at chest height and pointed down changes every leg angle in the frame. Put the camera on a tripod at roughly hip height, with the lens level and parallel to the floor.
Too low a frame rate, or too little light
Use 60 frames per second where the phone allows it, with good front-facing light so the shutter is fast enough to freeze the legs. Motion blur turns a knee into a smudge, forcing the tracking model to guess.
Clutter and clothing
Baggy shorts hide the knee. A dark tracksuit against a dark wall hides the outline. Mirrors and people walking behind the athlete give the tracker a second body to follow. Fitted clothing, visible shoes, and a plain background are the cheapest accuracy upgrade.
How to read a 2D gait report
1. Watch the video first. Check that the tracked skeleton sits on the joints throughout. If it jumps, swaps legs, or loses a foot, the numbers from those frames are not worth reading.
2. Check the context. Speed, treadmill or overground, shoes, surface, fatigue, the athlete's age and level. Many "out of range" values make sense once the context is known.
3. Weight each number by what the camera can see. Trust timing and side-view angles most. Read frontal-plane values for direction and trend. Treat forces and power as estimates. Do not look for rotation at all.
4. Compare the athlete with themselves. One session is a snapshot. The useful signal is change across sessions filmed the same way. When a value jumps sharply from one session to the next, first ask whether the filming changed, and only then whether the athlete did.
5. Connect the number to what you see and what the athlete feels. If the data says cadence is low, but the athlete looks smooth and feels good, ask whether there is anything to fix. A report should start a coaching conversation, not end one.
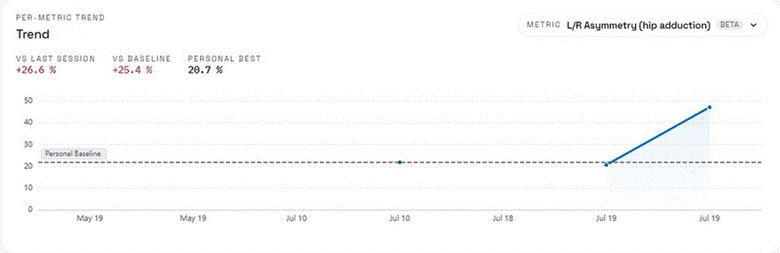
Figure 12. A sideways-hip asymmetry value more than doubles between two sessions. Before treating that as a change in the runner, confirm the camera position, distance, and treadmill speed were the same.
Quick reference: how far to trust each measure
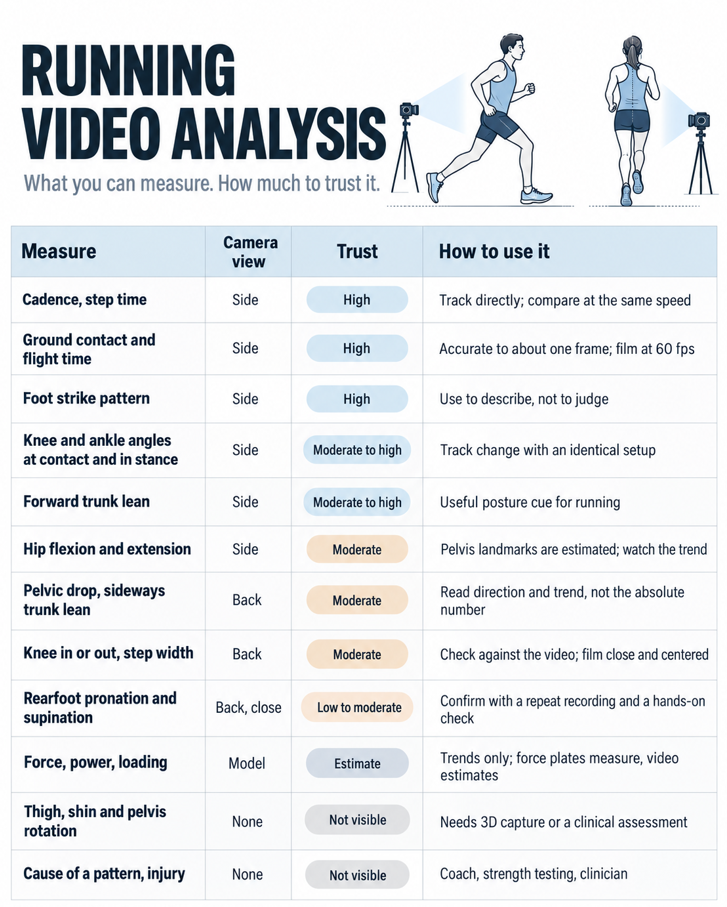
Ratings assume a correctly filmed clip and summarise the research cited below. Poor filming lowers every rating.

The bottom line
A phone camera will not replace a biomechanics lab, and it does not need to. On a tripod, square to the athlete, and left on long enough, it measures timing and side-view mechanics well, shows frontal-plane patterns usefully, and makes it realistic to check an athlete every few weeks instead of once a year. Its limits are predictable: depth, rotation, force, and cause. Know which questions the camera can answer, film to answer them, and keep the coach's judgment in charge of what happens next.
About the author. Anton Galvas is co-founder and CEO of AiKYNETIX, a markerless movement analysis platform that produces biomechanics reports from smartphone video, with independent laboratory testing at the University of Houston and Texas A&M University. He holds an MSc in Engineering and an MBA. The report examples in this article were produced with AiKYNETIX.
Clinical reviewer. Subhashree Easaki is a physiotherapist and Applied Sport Performance Specialist at AiKYNETIX.
References
1. Stenum J, Rossi C, Roemmich RT. Two-dimensional video-based analysis of human gait using pose estimation. PLoS Computational Biology. 2021;17(4):e1008935.
2. Validity and reliability of two-dimensional video-based assessment to measure joint angles during running: a systematic review and meta-analysis (PROSPERO CRD42022322798). Journal of Biomechanics. 2023.
3. Dingenen B, Barton C, Janssen T, Benoit A, Malliaras P. Test-retest reliability of two-dimensional video analysis during running. Physical Therapy in Sport. 2018.
4. Hensley CP, et al. Reliability and validity of 2-dimensional video analysis for a running task: a systematic review. Physical Therapy in Sport. 2022.
5. Peebles AT, Carroll MM, Socha JJ, Schmitt D, Queen RM. Validity of using automated two-dimensional video analysis to measure continuous sagittal plane running kinematics. Annals of Biomedical Engineering. 2021;49.
6. Reinking MF, et al. Comparison of 2-D and 3-D analysis of running kinematics and actual versus predicted running kinetics. International Journal of Sports Physical Therapy.
7. Assessing the validity of two-dimensional video analysis for measuring lower limb joint angles during fencing lunge. Frontiers in Sports and Active Living. 2024;6:1335272.
8. Perry J, Burnfield JM. Gait Analysis: Normal and Pathological Function. 2nd ed. SLACK; 2010.