Baseball, Basketball, Boxing, Cycling, Football - American, Golf, Gymnastics, Lacrosse, Martial Arts, Padel, Pickleball, Rugby, Skateboarding, Skiing, Snowboarding, Soccer, Softball, Speed Skating, Surfing, Swimming, Table Tennis, Taekwondo, Tennis, Volleyball, Weightlifting
What Is the Toughest Sport? We Ranked 118 of Them
Ask a boxer what the toughest sport is, and you might get one answer. Ask a cyclist, gymnast, hockey player or tennis professional, and you will probably get four more.
That is the problem with almost every debate about the “toughest sport.” Before anyone can answer the question, you first have to decide what tough actually means.
Is it pure physical exhaustion? Strength? Skill? The possibility of getting hurt? Mental pressure? Competing 80 times a year? Traveling around the world for 10 months while trying to recover and train?
At SportsEdTV, we decided not to settle the argument with another opinion.
We built a model.
We actually evaluated 130 elite sporting disciplines (We started with 118) using the same framework, published every underlying score, tested how the rankings change when the assumptions change, and then deliberately tried to break our own result.
Under the SportsEdTV methodology, ice hockey finished first.
But the more interesting story is why.

First, what exactly did we measure?
Our question was very specific:
Which sport asks the most of the elite athlete doing it?
We were not trying to determine which sport is the most popular, dangerous, prestigious, expensive, or difficult to become world-class in. Those are different questions.
We defined toughness through five major dimensions:
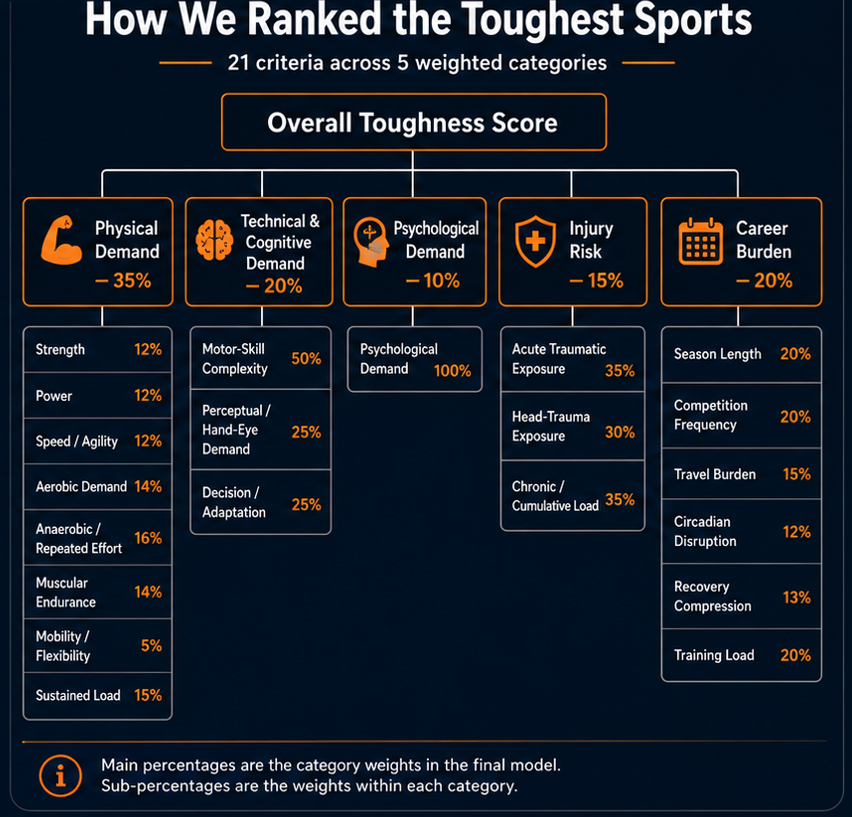
| Dimension | Weight | What we are measuring |
|---|---|---|
| Physical demand | 35% | Strength, power, speed, aerobic demand, repeated effort, muscular endurance, mobility and sustained workload |
| Technical and cognitive demand | 20% | Skill complexity, perception and hand-eye demands, decision-making and adaptation |
| Psychological demand | 10% | Pressure, nerve, irreversibility of mistakes and self-regulation |
| Injury risk | 15% | Acute trauma, head-trauma exposure and chronic accumulated wear |
| Career burden | 20% | Season length, competition frequency, travel, time-zone disruption, recovery compression and training load |
Those weights are our definition of toughness. They are not laws of physics. That distinction is fundamental to understanding the ranking.
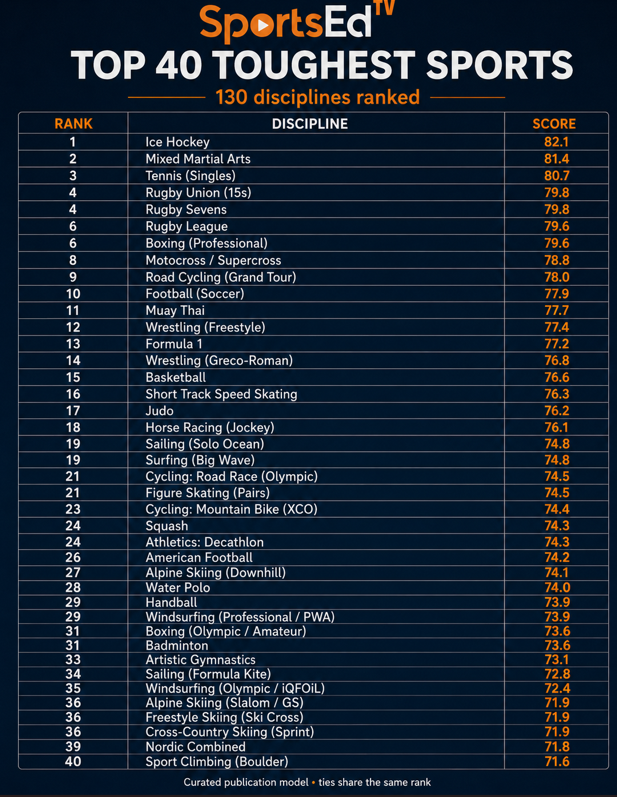
Under this definition, the Top 10 are:
- Ice hockey — 82.1
- Mixed martial arts — 81.4
- Tennis (singles) — 80.7
- Rugby union (15s) — 79.8
- Rugby sevens — 79.8
- Rugby league — 79.6
- Boxing (professional) — 79.6
- Motocross/supercross — 78.8
- Road cycling (Grand Tour) — 78.0
- Football (soccer) — 77.9
The first thing to notice is how different those sports are. That is exactly the point.

Why did ice hockey finish first?
Hockey does not dominate every category.
MMA is more physically demanding in our model. American football has a higher injury score. Tennis has a much greater career-burden score.
Hockey wins because it has almost no weak category.
Its scores are:
Physical: 8.06
Technical/cognitive: 8.75
Psychological: 8.00
Injury: 8.00
Career burden: 8.21
That combination produces 82.1.
A hockey player must generate repeated explosive efforts, accelerate and decelerate on skates, control a puck while moving at speed, process opponents and teammates in fractions of a second, absorb physical contact and repeat those demands across a dense professional calendar.
In other words, hockey's advantage is not that it is the single hardest sport at one thing. It is that it is extremely demanding at almost everything.
That result also survived our strongest test. When we simultaneously altered both the underlying sport scores and the five weights across 20,000 stress-test configurations, hockey remained in the Top 3 in 95.6% of them, with a median rank of first and a 90% rank range of first through third.
That does not mean there is a 95.6% probability that hockey is objectively the world's toughest sport. It means hockey remained extremely stable under the specific challenges we threw at the model.
That is a much more defensible claim.
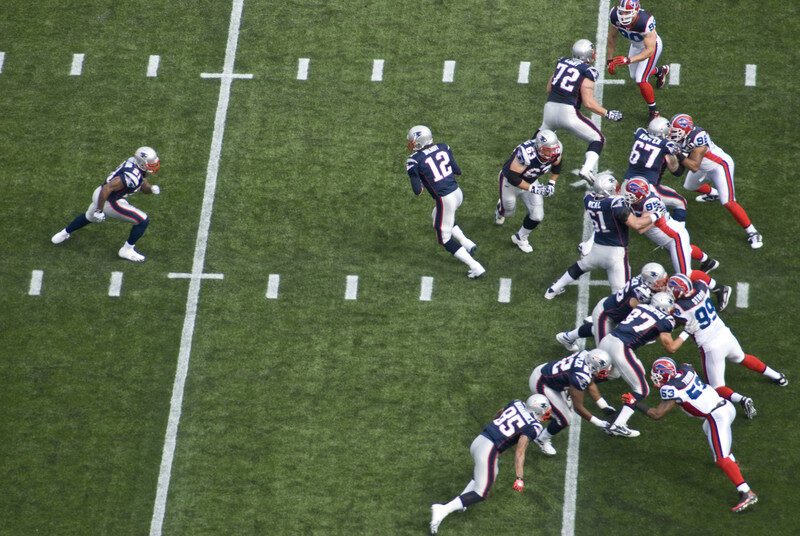
Then why is American football only 25th?
This will probably be one of the first questions American readers ask.
Football is extraordinarily demanding. Our model gives it a 9.0 for injury risk, higher than hockey's 8.0.
But the ranking is not a collision ranking.
Think of it as a school report card with five subjects. Football receives an A+ in some subjects. Hockey receives very high grades in almost all of them.
The biggest difference is career burden.
Hockey scores 8.21. American football scores 5.89.
The NHL regular season contains 82 games. An NFL regular season contains 17 games over 18 weeks. Both sports involve enormous preparation, training and recovery, but the frequency of actual competition, travel and compressed recovery is very different.
That one category gives hockey about 4.6 points of its 7.9-point advantage over football.
And our sensitivity tests reveal exactly how the model is behaving. Remove Career Burden entirely and American football rises from 25th to 15th. Remove Injury Risk instead, and it falls to 44th.
That tells us something useful.
Football's profile is unusually dependent on extreme collision and injury exposure. Hockey's profile is broader.
Twenty-fifth does not mean football is easy. Its score is 74.2 compared with hockey's 82.1, and many sports are tightly packed within that range.
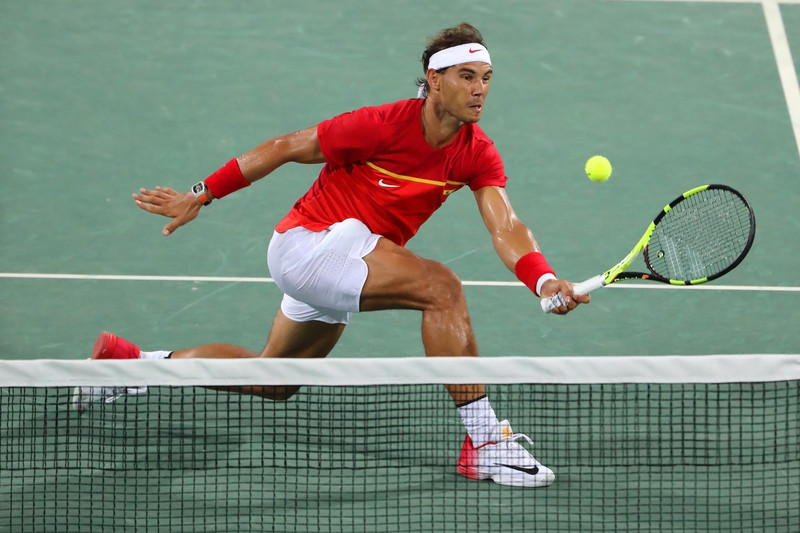
How can tennis possibly be third?
This may be the most controversial result.
The answer is that we are measuring the burden of being an elite athlete, not simply the violence or exhaustion of one contest.
Tennis scores only 5.15 on injury risk, far below hockey, rugby, MMA or boxing.
But tennis scores 8.15 physically, 8.75 technically and cognitively, and an extraordinary 9.47 for career burden.
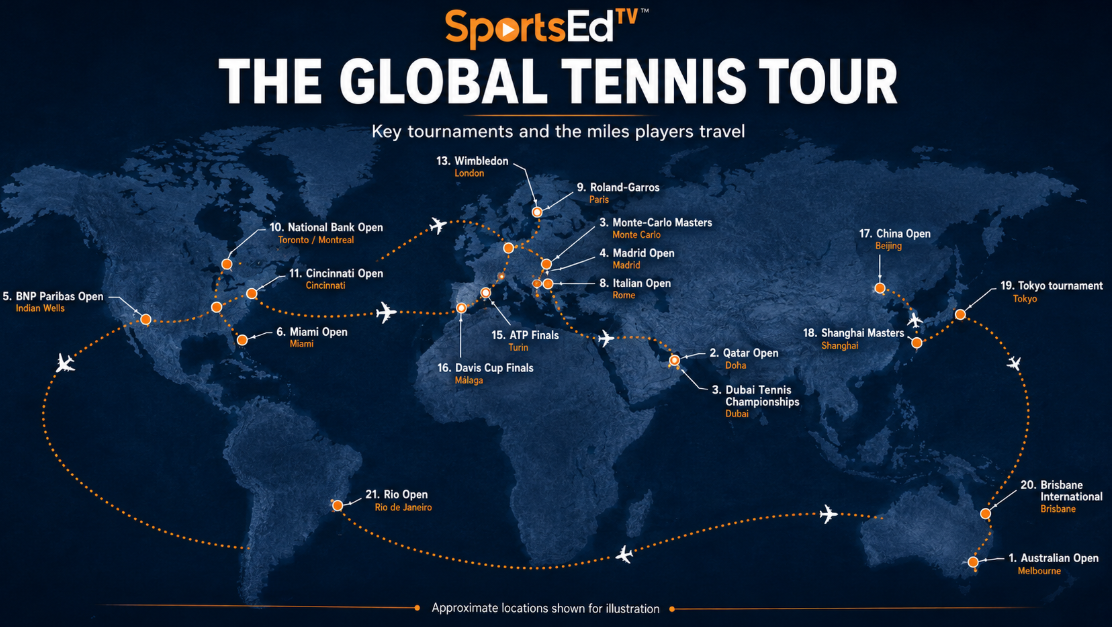
An elite singles player can compete across a season stretching from January into November, moving between countries and continents, changing time zones, recovering from matches, training and then competing again.
Career burden is deliberately 20% of our model because an athlete does not experience a sport for two hours in isolation. Elite sport is a job and, in some sports, practically a year-round lifestyle.
We can also see precisely how important this assumption is.
Remove Career Burden and tennis falls from third to 17th.
So if your personal definition of toughness is “what happens during the contest only,” you should disagree with tennis at #3.
And the model tells you why.
That transparency is one reason we built it this way.
Why isn't MMA number one?
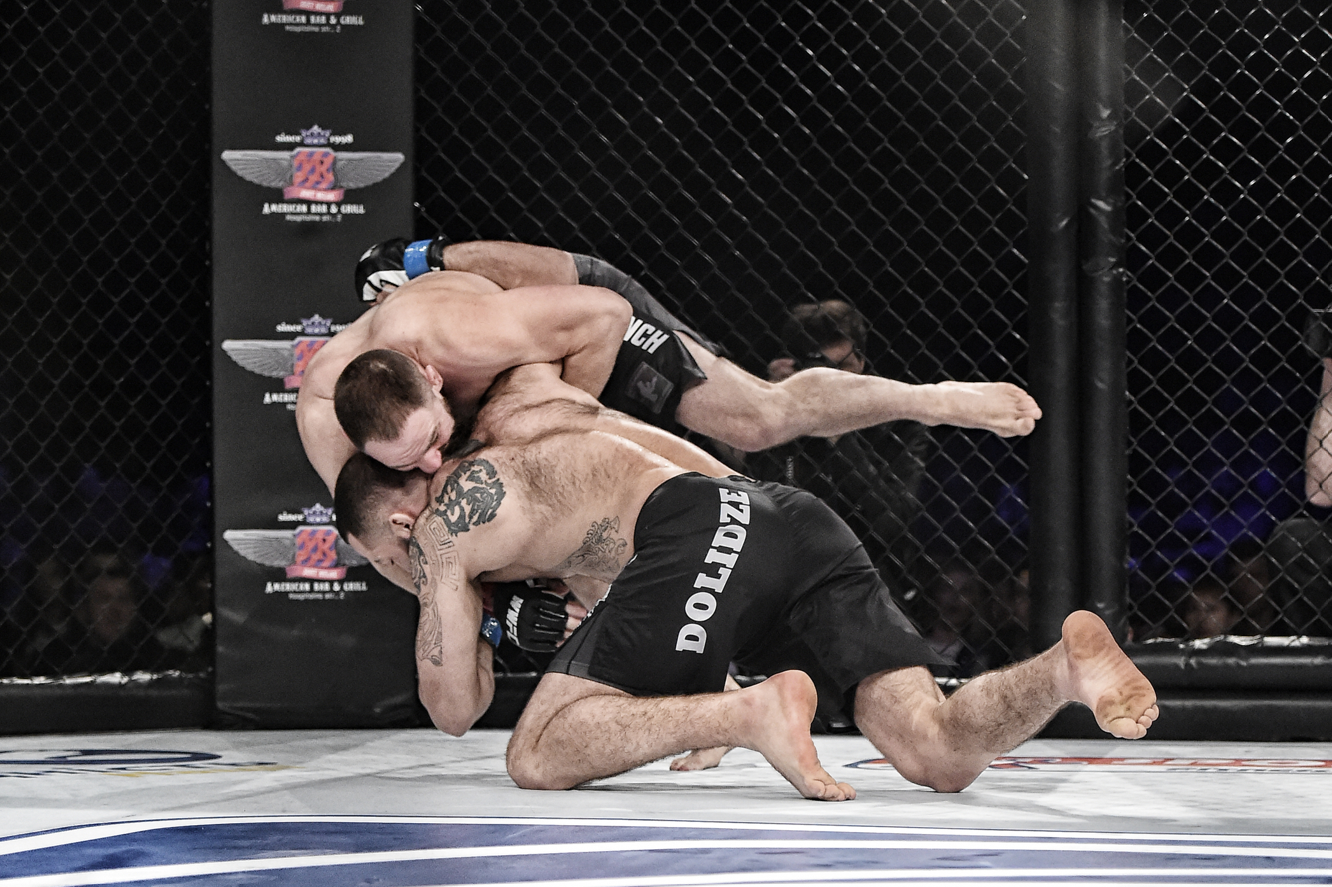
MMA actually beats hockey in three headline categories.
It scores 8.49 physically versus hockey's 8.06. It scores a perfect 10 psychologically. It also has a higher injury score, 8.65 versus 8.00.
Where MMA loses heavily is career burden.
Elite fighters train enormously, but they do not compete 82 times a season. MMA's Career Burden score is 5.87 compared with hockey's 8.21.
If we increase the importance of Physical Demand, MMA becomes #1. If we increase Injury Risk substantially, MMA becomes #1 again. If we remove Career Burden altogether, MMA becomes #1.
So saying “MMA should be first” is not an unreasonable criticism.
It is effectively saying: “I define toughness differently.”
That is exactly the discussion this project is designed to create.
Why isn't boxing first?
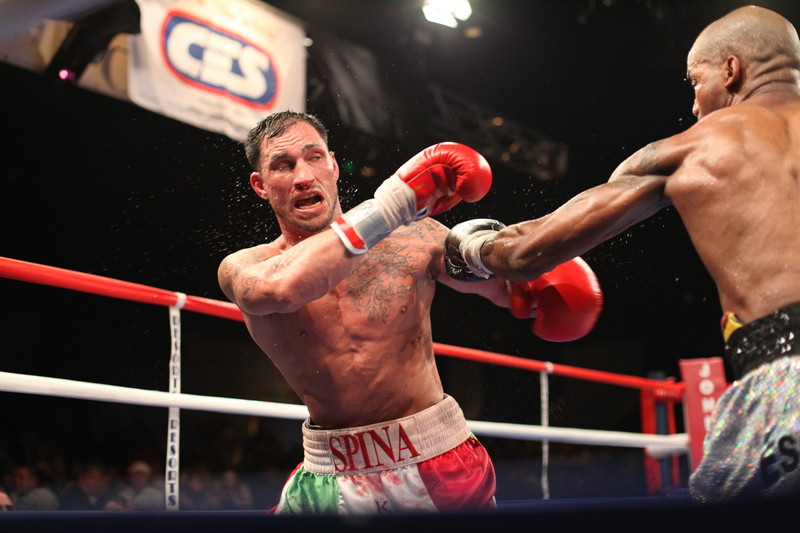
Professional boxing scores extremely highly where you would expect it to: physical demand, psychological pressure and injury exposure.
But again, competition frequency matters.
A professional boxer may train relentlessly, but actual bouts occur far less frequently than NHL games, tennis matches, basketball games or football matches.
Under our complete athlete-and-career definition, that matters.
Under a model focused primarily on danger, physical punishment and psychological pressure, boxing would rise considerably.
Why count travel as toughness?
Because recovery is part of elite performance.
Crossing time zones, disrupted sleep, repeated travel and short recovery windows affect the athlete who has to perform again days later. The model therefore includes travel, circadian disruption and recovery compression within Career Burden. The methodology draws on research on travel and sleep in professional tennis and basketball, while official league and tour calendars provide additional reality checks.
That does not mean taking an airplane is an athletic skill.
It means the elite athlete's job does not end when the whistle blows.
Why include injury risk? Isn't danger different from toughness?
This is one of the most legitimate philosophical objections to the model.
We excluded death risk because we consider that a consequence rather than an athletic demand. We also excluded cost of participation and the number of years required to reach the elite level.
But injury exposure is different because absorbing and managing repeated physical damage is part of performing the sport itself.
We divide it into acute trauma, head-trauma exposure, and chronic accumulated load. We intentionally do not simply count catastrophic danger.
You can still argue that injury should receive 5%, 25% or zero.
We tested that.
When Injury Risk is weighted much more heavily, MMA, rugby league and professional boxing move to the front.
Again, disagreement with the definition is allowed.
Where did the scores come from?
There are 21 underlying inputs behind the five main categories.
Rather than simply saying, “Hockey feels like an 8,” we created written scoring anchors for all 21 inputs. The workbook defines what scores of 1, 3, 5, 7, 9, and 10 mean, and interpolates intermediate even-number scores between those definitions.
That does not magically turn every score into a laboratory measurement.
Most inputs remain structured editorial judgments.
The difference is that the judgment has to satisfy a published definition. Anyone can inspect it, challenge it, and identify precisely which number they believe should change.
For the Top 30 alone, the workbook includes hundreds of separate evidence-ledger entries, one for each of the 21 inputs for each sport.
Did you use any actual measured data?
Yes, where comparable data exists.
We checked aerobic demand against the 2024 Adult Compendium of Physical Activities, based on 2,356 energy-expenditure values from 701 papers across 1,114 activities.
For 63 matched disciplines, our aerobic scores correlated with the Compendium MET values (Spearman ρ = 0.711). Among the 44 entries classified as directly measured, the correlation was 0.658. We revised eight aerobic scores after external evidence materially disagreed with the original rating.
We also used published injury surveillance and official competition calendars as directional checks.
But we deliberately did not pretend all sports science data is comparable. An injury rate per 1,000 NHL player-game-hours cannot simply be placed beside a tennis injury rate per 1,000 playing hours and treated as the same statistic.
Is this a scientific study?
No.
It is a transparent, evidence-informed analytical ranking.
That distinction matters.
The scientific literature helps us define and check parts of the model. The calculations and simulations are reproducible. But many underlying scores are editorial judgments against standardized anchors rather than direct measurements.
SportsEdTV therefore does not claim:
“Science proves ice hockey is the toughest sport.”
Our claim is:
“Under the SportsEdTV methodology, ice hockey ranks first.”
Those are very different statements.
Was only one person responsible for the ratings?
The baseline is an editorial scoring model, not an expert-consensus survey.
That is a limitation, and we do not hide it.
Instead, we made the complete scoring architecture public: the definitions, the 21 input anchors, every sport's scores, the evidence ledger, external checks, sensitivity tests, robustness simulations, and the scoring audit trail.
The objective is not to remove judgment from a question that inherently requires judgment. It is to make the judgment visible and challengeable.
Aren't 1-to-10 ratings mathematically questionable?
They have a limitation.
When we calculate the composite, we treat the difference between 4 and 5 as numerically equivalent to the difference between 8 and 9.
We do not claim that nature actually works that way.
It is a modeling convenience, and the methodology explicitly says so.
The detailed anchor dictionary reduces the ambiguity by defining what different levels mean, but it does not turn an editorial scale into an objective physical unit.
That is another reason tiny differences such as 79.8 versus 79.6 should not be overinterpreted.
What happens if I don't agree with your weights?
Good.
Change them.
We ran 50,000 different reasonable weight combinations to see exactly how much the outcome depended on our definition.
Hockey finished first in about 68% of those weight configurations and remained Top 3 in essentially all of them. MMA finished first about 20% of the time. Tennis finished first about 11%.
Then we ran a harder test.
We changed both the weights and the underlying scores simultaneously across another 20,000 configurations.
Hockey still had a median rank of #1 and remained Top 3 in 95.6% of those tests.
That does not prove our definition is correct.
It tells us the headline result isn't hinging on one convenient decimal point.
Why 130 disciplines rather than 130 sports?
Because “sport” is often too broad a category.
A marathon and shot put are both athletics, but comparing them as one generic sport would be meaningless. The same is true of downhill skiing and cross-country skiing, Olympic boxing and professional boxing, rugby sevens and rugby union, or Boulder and Lead climbing.
We therefore ranked disciplines separately when different events created materially different demands on the athlete. The final publication dataset contains 130 major Olympic and professional sports disciplines.
Is the ranking for men or women?
The baseline predominantly uses men's elite competition where a men's event exists.
Women-only Olympic disciplines are scored as contested, while open and mixed events are treated in their actual format.
That means this should not be described as a universal sex-neutral ranking.
A future women's-specific version could produce different results, particularly in sports where calendars, formats or competitive structures differ.

So what is the real conclusion?
It would be easy to publish a graphic saying:
“Science says hockey is the toughest sport.”
We won't.
What this project actually shows is more interesting.
No universally correct answer exists until you define toughness.
We defined it. We scored elite disciplines against that definition. We published the 21 underlying inputs. We checked parts of the model against outside evidence. We ran 50,000 alternative weight combinations, 20,000 score perturbations and 20,000 combined score-and-weight challenges. We deliberately looked for weaknesses and documented them.
After all of that, ice hockey remained the most stable overall leader.
But MMA can win under a more physically or injury-heavy definition. Tennis falls sharply if you exclude the demands of the professional calendar. American football rises if you stop counting career burden and falls dramatically if you stop counting injury risk.
We ultimately stopped at 130 disciplines.
That number is not meant to represent every competitive activity or every ruleset sanctioned somewhere in the world. Once we expanded the universe far enough, it became clear that there is no natural stopping point. International federations govern hundreds of event variations, formats and subdisciplines, many of which are closely related.
So we chose a defined editorial universe: major Olympic disciplines together with selected major professional disciplines, separating formats when the demands on the athlete were materially different. Olympic and professional windsurfing, for example, are scored separately, while minor variations of essentially the same athletic task are not automatically given their own ranking.
The goal was not to manufacture the largest possible list. It was to build a broad enough universe to make the comparison meaningful while keeping every entry defensible and comparable under the same methodology.
That may be the most useful result of the entire exercise.
The question is no longer simply:
“What is the toughest sport?”
It is:
“What do you mean by tough?”
And now we can show exactly how changing that definition changes the result.
Complete list of the World Toughest Sports
1 Ice hockey 82.10
2 Mixed martial arts 81.40
3 Tennis (singles) 80.70
4 Rugby union (15s) 79.80
4 Rugby sevens 79.80
6 Rugby league 79.60
6 Boxing (professional) 79.60
8 Motocross / supercross 78.80
9 Road cycling (Grand Tour) 78.00
10 Football (soccer) 77.90
11 Muay Thai 77.70
12 Wrestling (freestyle) 77.40
13 Formula 1 77.20
14 Wrestling (Greco-Roman) 76.80
15 Basketball 76.60
16 Short track speed skating 76.30
17 Judo 76.20
18 Horse racing (jockey) 76.10
19 Sailing (solo ocean) 74.80
19 Surfing (big wave) 74.80
21 Cycling: road race (Olympic) 74.50
21 Figure skating (pairs) 74.50
23 Cycling: mountain bike (XCO) 74.40
24 Squash 74.30
24 Athletics: decathlon 74.30
26 American football 74.20
27 Alpine skiing (downhill) 74.10
28 Water polo 74.00
29 Handball 73.90
29 Windsurfing (professional / PWA) 73.90
31 Boxing (Olympic / amateur) 73.60
31 Badminton 73.60
33 Artistic gymnastics 73.10
34 Sailing (kite / Formula Kite) 72.80
35 Sailing (windsurfing / iQFOiL) 72.40
36 Alpine skiing (slalom / GS) 71.90
36 Freestyle skiing (ski cross) 71.90
36 Cross-country skiing (sprint) 71.90
39 Nordic combined 71.80
40 Sport climbing (boulder) 71.60
41 Modern pentathlon 71.10
42 CrossFit Games 71.00
42 Beach volleyball 71.00
44 Cycling: track endurance / omnium 70.70
45 Sumo 70.40
45 Snowboard cross 70.40
47 Freestyle skiing (moguls) 70.30
47 Sport climbing (lead) 70.30
49 Taekwondo 70.00
50 Surfing (shortboard) 69.90
51 Figure skating (ice dance) 69.30
52 3x3 basketball 69.20
53 Lacrosse (sixes) 69.10
53 Rowing: coastal beach sprint 69.10
55 Figure skating (singles) 69.00
56 Cycling: BMX racing 68.90
56 Fencing 68.90
58 Baseball 68.80
59 Biathlon 68.50
60 Pickleball (singles) 68.40
61 Field hockey 68.30
62 Cross-country skiing (distance) 68.00
63 Obstacle course racing 67.70
64 Bull riding 67.00
64 Equestrian: eventing 67.00
66 Rowing 66.90
67 Freestyle skiing (halfpipe / slopestyle) 66.80
67 Snowboard (halfpipe / slopestyle) 66.80
69 Triathlon (Olympic distance) 66.70
70 Canoe slalom 66.50
70 Cycling: road time trial 66.50
72 Ski mountaineering 66.30
73 Bobsleigh 65.50
74 Athletics: 3000m steeplechase 65.10
74 Speed skating (long track distance) 65.10
76 Trampoline 64.60
76 Sailing (Olympic boat classes) 64.60
78 Triathlon (Ironman) 64.50
79 Pickleball (doubles) 64.40
80 Cycling: track sprint 64.30
80 Skateboarding (park / street) 64.30
82 Equestrian: show jumping 64.20
82 Cycling: BMX freestyle 64.20
84 Swimming (distance, 800/1500m) 64.10
84 Snowboard (parallel giant slalom) 64.10
86 Volleyball (indoor) 64.00
87 Rhythmic gymnastics 63.90
88 Marathon swimming (10km open water) 63.80
89 Cricket (T20) 63.70
90 Speed skating (long track sprint) 63.60
91 Freestyle skiing (aerials) 62.90
91 Athletics: pole vault 62.90
91 Artistic swimming 62.90
94 Ski jumping 62.70
94 Skeleton 62.70
96 Athletics: 10000m 62.00
96 Athletics: 1500m 62.00
96 Athletics: triple jump 62.00
96 Swimming (middle distance, 200/400m) 62.00
100 Canoe sprint 61.50
100 Table tennis 61.50
102 Athletics: 400m sprint 61.40
103 Athletics: 110m hurdles 61.20
104 Padel 60.90
105 Softball 60.80
106 Diving (10m platform) 60.70
107 Athletics: marathon 60.60
108 Golf 60.50
109 Freediving 60.00
110 Luge 59.40
111 Swimming (sprint, 50/100m) 59.10
112 Athletics: long jump 58.90
112 Athletics: half-marathon race walk 58.90
114 Diving (3m springboard) 58.20
115 Athletics: 100m sprint 57.80
115 Flag football 57.80
117 Sport climbing (speed) 57.30
118 Athletics: javelin 57.20
119 Weightlifting 56.40
120 Athletics: high jump 55.50
121 Athletics: hammer throw 54.70
121 Athletics: shot put 54.70
123 Athletics: discus 54.30
124 Equestrian: dressage 52.20
125 BASE jumping 49.90
126 Archery 49.70
127 Shooting 47.80
128 Curling 46.20
129 Snooker / billiards 43.90
130 Ten-pin bowling 39.40