Few debates in sports are more familiar than the argument over the greatest quarterback of all time.
Tom Brady has seven championships. Peyton Manning has five MVP awards. Joe Montana was unbeaten in his first four Super Bowls. Aaron Rodgers produced efficiency numbers that earlier generations could barely have imagined. Otto Graham played in a completely different version of professional football and reached the championship game in every season of his career.
So how do you compare them?
That is the problem we wanted to tackle.
Rather than start with a list of names and work backward to justify it, SportsEdTV built a model from the ground up. We evaluated 63 historically significant quarterbacks across professional football history, from the early NFL through the 2025 season, and applied the same scoring framework to all of them. Every statistical input is sourced, every weight is disclosed, and the assumptions behind the model are available for readers to examine.
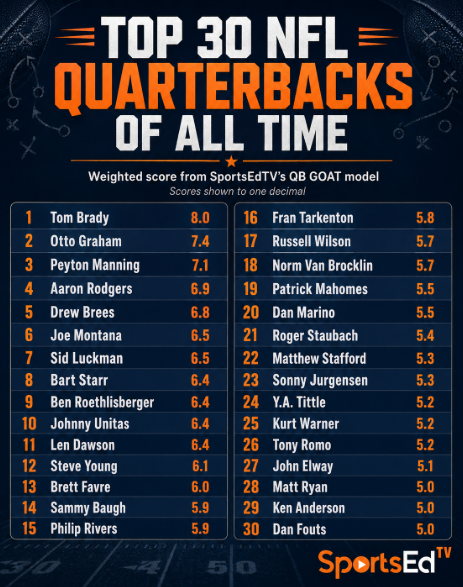
The result is our ranking of the 30 greatest NFL quarterbacks of all time.
But the ranking itself is only half the story. The methodology matters just as much.

The problem with comparing quarterbacks across eras
Looking at raw statistics alone simply does not work.
A quarterback playing today operates in a league built around passing. Rules protect quarterbacks and receivers more than they did decades ago. Teams throw more often. Seasons are longer. Offensive systems are more sophisticated, and passing efficiency across the league has risen dramatically.
A passer rating of 90 meant something very different in 1960 than it does today.
The opposite problem exists with career totals. A quarterback playing a 12-game schedule had fewer opportunities to accumulate yards, touchdowns and appearances than someone playing 17 games.
Any serious historical ranking therefore has to answer two questions:
How good was the quarterback relative to the environment in which he played?
And:
How do we compare careers when the amount of football available to players changed so much?
Those questions shaped the model.
What the model measures
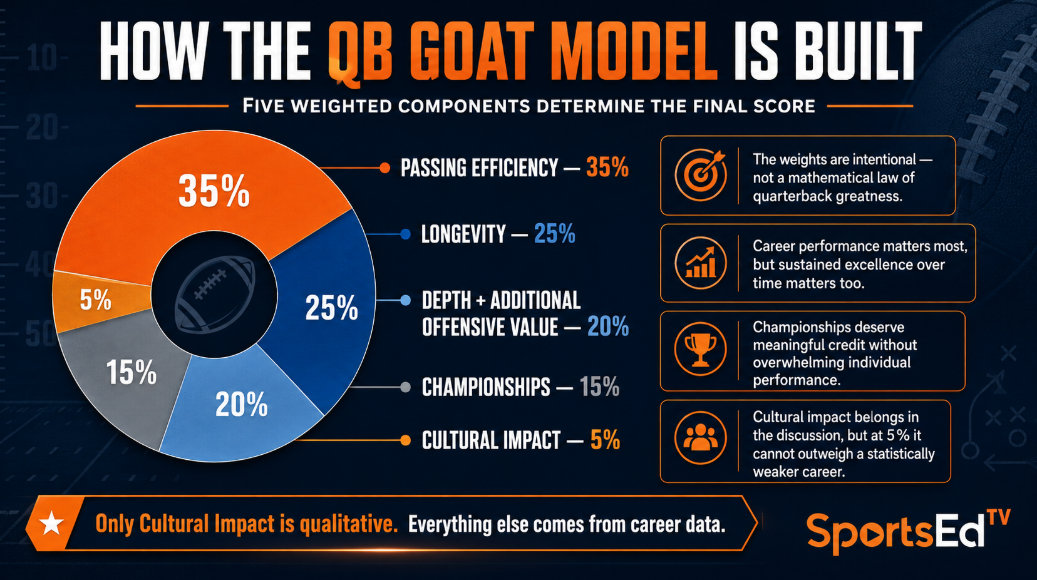
The final score is built around five components.
Passing efficiency carries the greatest weight at 35%. Longevity accounts for 25%, followed by depth and additional offensive value at 20%, championships at 15%, and cultural impact at 5%.
Those percentages are intentional. They are not presented as a mathematical law of quarterback greatness.
We wanted career performance to matter most, but we also believe greatness involves sustaining that performance over time. Championships deserve meaningful credit without allowing team success to overwhelm individual performance. And cultural impact belongs in the conversation, but at only 5%, it cannot turn a statistically inferior career into a great one by itself.
That last category is also the only part of the model that is qualitative. Everything else comes from career data.
Accounting for the era
This was one of the most important parts of the project.
Career passer rating and yards per attempt are not simply dropped into the model as raw numbers. They are evaluated against the passing environment that existed during the quarterback's actual career.
That means quarterbacks from earlier periods are not being judged against today's offensive environment.
The calculation uses season-by-season league averages across a player's career span. It also recognizes that the AAFC and AFL had their own statistical environments rather than treating every season as though it occurred in the NFL.
We deliberately did not make the entire score era-relative, either.
The model blends era-adjusted performance with an unadjusted component. That matters because completely normalizing everything to an era can create a different distortion by giving too much credit simply for being ahead of a weaker historical baseline.
The goal is balance: recognize the environment without pretending the environment explains everything.
Longevity is not just games played
This is another area where a simple career total can be misleading.
NFL schedules have ranged from roughly 10 to 12 games in parts of the early league to today's 17-game schedule. Counting 170 career games the same way across all eras would therefore create an obvious historical bias.
Instead, the model converts games played into what we call Season-Equivalents.
A quarterback's career games are compared with the average scheduled season length during the years in which he actually played. So a career spanning 12-game and 14-game seasons is evaluated using the mixture of schedules that player experienced rather than assigning him to one arbitrary era.
This does not make longevity perfectly comparable across 90 years of football, but it makes the comparison considerably more defensible than raw games played.
Preventing short careers from distorting the ranking
Rate statistics create another problem.
A quarterback with relatively few attempts can produce an extraordinary career passer rating or yards-per-attempt figure based on a much smaller body of evidence than someone who sustained his performance through 7,000, 8,000 or 10,000 attempts.
To address that, the model uses statistical shrinkage.
In simple terms, smaller samples are pulled somewhat toward the appropriate statistical average. The more career attempts a quarterback has, the less adjustment occurs. Large careers largely stand on their own evidence; small careers have to overcome greater uncertainty.
The model uses approximately five seasons of typical passing volume as the strength of that adjustment. That choice is disclosed because it is a methodological judgment rather than a number handed down by nature.
That distinction is important. We are not trying to make the model look more precise than it is.
Championships matter, but there is a rule
We also needed a consistent definition of a quarterback championship.
The model awards a title when the quarterback started the deciding championship game or Super Bowl, whether or not he ultimately finished the game.
NFL, AFL, and AAFC championships are counted because each represented major professional football championships in its respective period.
That decision matters.
Otto Graham, for example, receives credit for seven championships, including four won with Cleveland in the AAFC. Someone who believes an AAFC championship should be discounted relative to a Super Bowl will naturally view Graham differently.
That is a legitimate disagreement. It is also exactly why the assumptions are published.

Quarterbacks also create value with their legs
Passing statistics alone increasingly fail to capture the full value of the position.
The model therefore includes rushing production using rushing yards and rushing touchdowns on a per-game basis. This gives quarterbacks who consistently created offense on the ground credit without simply rewarding whoever played the longest.
MVP seasons are also included as a modest recognition of peak performance. Multiple organizations naming the same quarterback MVP in one season still count as a single MVP-caliber season rather than multiple awards.
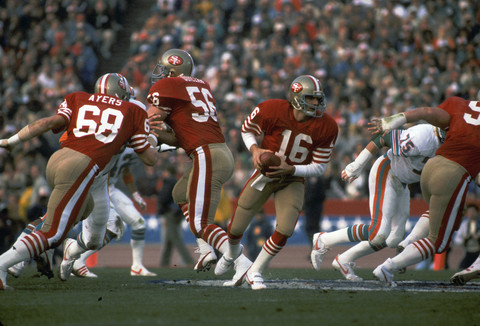
Joe Montana, San Francisco 49ers QB
Turning different statistics into one score
Statistics such as passer rating, career length, rushing value and championships obviously exist on completely different scales.
To combine them, the statistical portions of the model use z-score normalization.
Instead of simply ranking quarterbacks first through 63 in every category, the calculation measures how far each player's performance sits above or below the group average. Those results are then translated onto a common scoring scale.
That preserves the magnitude of the differences. A large statistical advantage should count more than a tiny one.
We also tested what happens when the weights change
One of the easiest ways to manipulate a ranking is to choose weights that produce the answer you wanted in the first place.
So we tested several different weighting philosophies.
Some placed more emphasis on efficiency. Another increased the value of championships. Another distributed the categories more evenly.
The most interesting result was at the very top.
Across the five weighting scenarios tested, Tom Brady and Otto Graham were the only quarterbacks to finish No. 1. Brady led two scenarios, including the published model. Graham led three. Both remained in the top three under every weighting tested.
That does not prove that either man is objectively the greatest quarterback who ever lived.
It tells us something more useful: under several reasonable definitions of quarterback greatness, their cases remain unusually difficult to dislodge.
The SportsEdTV Top 30 NFL Quarterbacks of All Time
- Tom Brady
- Otto Graham
- Peyton Manning
- Aaron Rodgers
- Drew Brees
- Joe Montana
- Sid Luckman
- Bart Starr
- Ben Roethlisberger
- Johnny Unitas
- Len Dawson
- Steve Young
- Brett Favre
- Sammy Baugh
- Philip Rivers
- Fran Tarkenton
- Russell Wilson
- Norm Van Brocklin
- Patrick Mahomes
- Dan Marino
- Roger Staubach
- Matthew Stafford
- Sonny Jurgensen
- Y.A. Tittle
- Kurt Warner
- Tony Romo
- John Elway
- Matt Ryan
- Ken Anderson
- Dan Fouts
The published ordering comes directly from the model's default weighting.

A ranking is only as credible as what it admits
There are limitations.
Yards per attempt overlaps to some degree with passer rating. The statistical shrinkage strength is a judgment call. Longevity uses career games rather than starts because comparable starting data are not consistently available across the entire historical period. There is no dedicated three- or five-year peak-performance calculation. Rushing statistics cannot capture every scramble, first down or extended play. And cultural impact cannot be reduced to a clean box-score statistic.
We would rather disclose those limitations than bury them.
And this ranking will evolve. Patrick Mahomes and Lamar Jackson, among others, are still adding to their careers. Career-length measures are particularly important in this model, so an active quarterback can move substantially as his body of work grows.
The purpose is not to end the GOAT debate. Sports debates are not supposed to end.
The purpose is to improve the debate.
Instead of saying, I think this player belongs ahead of that player, readers can now ask a more interesting question:
Which part of the definition of greatness would I change, and what happens to the ranking when I do?
That is why we are publishing the work behind the list.
Check the methodology yourself
For readers who want to go deeper, SportsEdTV is making both supporting documents available:
[Read the complete Methodology White Paper]
[Open the complete Excel model and data]
The spreadsheet contains the full 63-quarterback field, the underlying inputs, formulas and scores. The accompanying white paper explains the methodology, sourcing, era adjustments, statistical treatment, sensitivity testing and known limitations in greater detail.
We don't expect everyone to agree with the ranking. We do want everyone to be able to see how we got there.