Volleyball
Welcome and thanks for visiting...

What factors determine victory in volleyball? Examining the 2019 Final Four NCAA Women's Championship by Leandro Dutra & Gylton Da Matta Ph.D.
Science has become the new paradigm of analysis and observation in the game of volleyball. The purpose of this article is to share with the American and international volleyball community the game analysis of the women's 2019 NCAA finals.
This analysis was made possible using data from the Volleymetrics® evaluation system adopted during the period, I was at the Nebraska Athletic Performance Laboratory (NAPL) at the University of Nebraska and contrasting the data with the former technical evaluators of the FIVB, Dr. Gylton Da Matta.
These results were shared with Head Coach John Cook and staff from the University of Nebraska volleyball program and we are now pleased to share these findings through the SportsEdTV blog. The peer debriefing and the member checking strategies utilized helped to create trustworthiness of the data analysis, but the statistical input provides a reliable and valid information for volleyball coaches and professionals in this field. The authors also recognize the meaning of a powerful collaboration between the researchers with the Head Coach John Cook and with Dr. Chris Bach, the Director of the NAPL. Our sincere thanks for the opportunity to work at the University of Nebraska with these experts.
Modern volleyball analysis has adopted the concept of embracing complex systems versus examining singular skills. In order to better understand the game of volleyball, we (coaches, athletes and scholars) need to consider the holistic relation and interdependent function between the fundaments of the game into the transitions (complex stages) of the game (Palao & Ahrabi-Fard, 2011; Silva et al., 2016).
The volleyball game has two transitions. Transition I is called side-out which represents the complex of opposing serve, serve-receive, setting, and attack systems.
Transition II represents the counterattack phase which is the complex of blocking-defense system, plus the setting, and attack systems.
In the past, several game analysts have provided a dichotomized view of the game. The authors would like to invite the volleyball community to embrace the complex systems, which includes even what types of serves performed in the display of an outcome of any given rally.
With the introduction of the jump serves (Top-spin and Jump Floater), coaches and players are now wondering… “What should we practice more? The side-out or the counterattack?” Which of these two processes determines victory in intercollegiate women's volleyball matches?
Volleyball coaches need the practice which will help their teams to win. Coaches also need to practice what happens in the game.
With that in mind, this study aims to investigate and show which factors predict victory in the women's volleyball matches of the 2019 NCAA season. The analyzed data were 31 matches of the bracket of the 2019 season of the NCAA women's volleyball. This analysis used an innovative approach aspect, considering the miss serves as success of Transition I for the receiving team. The results demonstrated that the teams that showed greater efficiency in Transition I won sets and matches. In 117 sets analyzed, greater efficiency of Transition I indicated the victory in the set, 98 out of 117 sets (84%). Likewise, in 28 out of 31 matches (90%) won their matches. A statistic logistic regression (SPSS) revealed that Transition I contributed (69%) and Transition II (7%) to predict victory in volleyball matches.
Thus, the model predicts 76% of wins in matches. Transition I (side-out) efficiency proved to be the most important predictor variable to represent victory in women's volleyball matches.
The protocol for this analysis consists of observing these two phases of the game through the real videos provided by Volleymetrics®. The final efficiency was calculated through the new formula adding all kills of the side-out team (including the miss serves of the opponent team), minus errors of the side-out team, divided by the total of attempts.
This type of analysis through an interaction background between the systems that make up the Transition I and II of the volleyball game has been suggested by Ugrinowitsch et al., (2014). In this study, it was demonstrated that the greater efficiency of Transition I in the men's team was also the predictor of victory in volleyball matches. Therefore, for men´s and women´s teams the greatest efficiency in the side-out phase or this new Transition I framework revealed to be the determining factor in winning the volleyball sets and matches.
These findings seem fundamental for teachers and coaches to optimize their practice schedules through Transition I of the women's volleyball game. These results can guide pedagogical decisions in the teaching of the sport towards effective leadership in coaching, planning and success in volleyball.
Practical applications
We would like to exemplify through two drills the practical application of these findings. The authors suggest that coaches should adopt game-like situations and plan more drills for the sideout phase. See Drill 1 and Drill 2 as two models of contextual simulations for any level of expertise.
Drill 1 – Rotations Simulations (e.g., Rotation 1), a sequence of four serves in the same rotation. Serves must be performed alternately from origin P1 and P5 with a straight in and diagonal trajectory. Depending upon the types of serves displayed in your competition, serves must follow the styles with the highest incidence in your region. The goal is to try to reach the side-out point with each attempt.
Drill 2 – Rotations Practice Switching “The Wheel” (e.g., Rotation 3), a sequence of three serves in the same rotation. After the execution of a service, an assistant performs a ball toss to the setter in a condition different from the previous serve reception in order to maximize the variability of practice (e.g., if a perfect pass occurs in the service reception, the ball toss must be medium or bad pass… off system pass). Therefore, the toss of the ball will always reproduce a new setting condition depending on the previous reception. The objective of the drill is to modify the setting of points in the same rotation to emphasize the side-out (we suggest prioritizing the out of system conditions because the incidence of such pass is happening at high rates in real game situations). Summary: Serve plus a second ball (i.e., extra ball) to the serve-receive team with a higher level of difficulty condition.
Table 1. Performance of the top five teams of the 2019 season by rotation in the NCAA Division I.
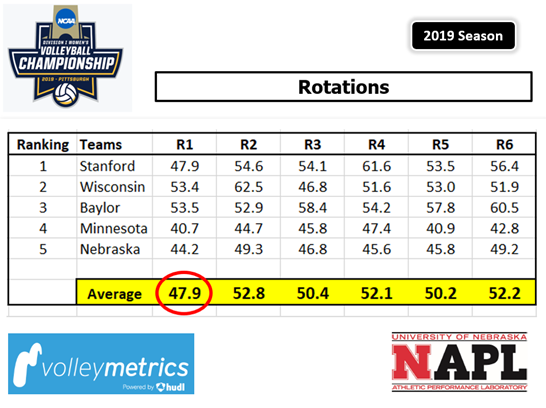
As we have mentioned before, the efficiency scores shown in this Table 1, highlight that if top college teams aim to win the NCAA Championship those teams must outperform their opponents with an efficiency superior than 50% in each rotation.
Notice that Stanford was the Champion in 2019, even though its score in rotation 1 (R1) was below that threshold, but it was above in all other rotations, generating at side-out mean of M = 54.6 and we have rounded up to 55% as a conservative suggestion. Nonetheless, one question raises… What R1 presents a lesser efficiency? Uh… Food for thought!
Further analyses elicited the need to group to top three finalists (successful teams) and the two lower ranked teams (4th and 5th places) and we found an interesting pattern that provides an important parameter associated with their final positions.
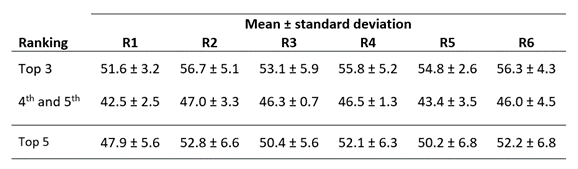
Based on the data collected, we have been able to input all percentages of efficacy per rotation of the top five teams in the 2019 Women’s NCAA Final Four Championship. The data shows that all top three teams achieve a higher than 50% efficiency rate in all six rotations in the side-out phase. The data also revealed that both the 4th and 5th place teams did not reach the 50% threshold in any of their rotations. The data is consistent between teams and the M = mean of each team. The top three teams M = 54.7 was higher than the lower teams M = 45.3. See Table 2 and 3.
Table 2. Mean and standard deviation of the ranking teams of the 2019 season by rotation in the NCAA Division I.
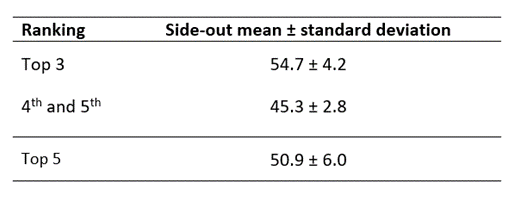
Just to confirm the importance of this finding, these analyses reveal the threshold of 50% efficiency in modern NCAA performances. Table 3 shows that top three teams demonstrated a 54.7% efficiency and 4th & 5th places 45.3% side-out efficiency. Thus, an efficiency mark inferior to a 50% side-out efficiency threshold is not sufficient to be a medalist in the Collegiate volleyball competition in the United States.
Table 3. Total mean and standard deviation of the ranking teams of the 2019 season in the NCAA Division I.
Further game analyses of complex systems by association of fundamentals (complex 1 and complex 2, as known as KI and KII) around all six rotations confirms that a competitive team must reach the 55% rate efficiency in the side-out to be a winner at the intercollegiate level (Silva et al., 2016). Notice that these calculations are simplified so everyone (practitioners and scholars) can understand, nonetheless, it is also important to consider that the holistic examination including, the serves of opponent teams helps the general public to understand volleyball from a tactical and strategic standpoint.
In addition, the results of this research and the performance parameters of the top five teams in the NCAA Division I provide meaningful insights for coaches’ education programs, which is an innovative approach from the Coaching and Game Analysis/Measurement perspective of the volleyball game for the preparation of teachers related to physical education coaching education and sports through higher education coaches’ preparation.
Practice side-out in a higher rate, if you want to win!
References
Palao, J., & Ahrabi-Fard, I. (2011). Side-out success in relation to setter’s position on court in women’s college volleyball. International Journal of Applied Sports Sciences, 23 (1), 155-167.
Silva, M., Sattler, T., Lacerda, D., & João, P. V. (2016). Match analysis according to the performance of team rotations in Volleyball. International Journal of Performance Analysis in Sport, 16 (3), 1076-1086.
Ugrinowitsch, H., Lage, G. M., Santos-Naves, S. P. D., Dutra, L. N., Carvalho, M. F. S., Ugrinowitsch, A. A. C., & Benda, R. N. (2014). Transition I efficiency and victory in volleyball matches. Motriz, 20 (1), 42-46.
Authors
Leandro Dutra, Ph.D. Candidate University of Nebraska-Lincoln (Nebraska Athletic Performance Laboratory) and Federal University of Minas Gerais-Brazil. dutraln@gmail.com
Gylton Da Matta, Ph.D. Colorado State University and Volleyball Executive Director SportsEdTV. gdamatta@sportsedtv.com