Tennis
Welcome and thanks for visiting...
SportsEdTV Talks With Craig O'Shannessy
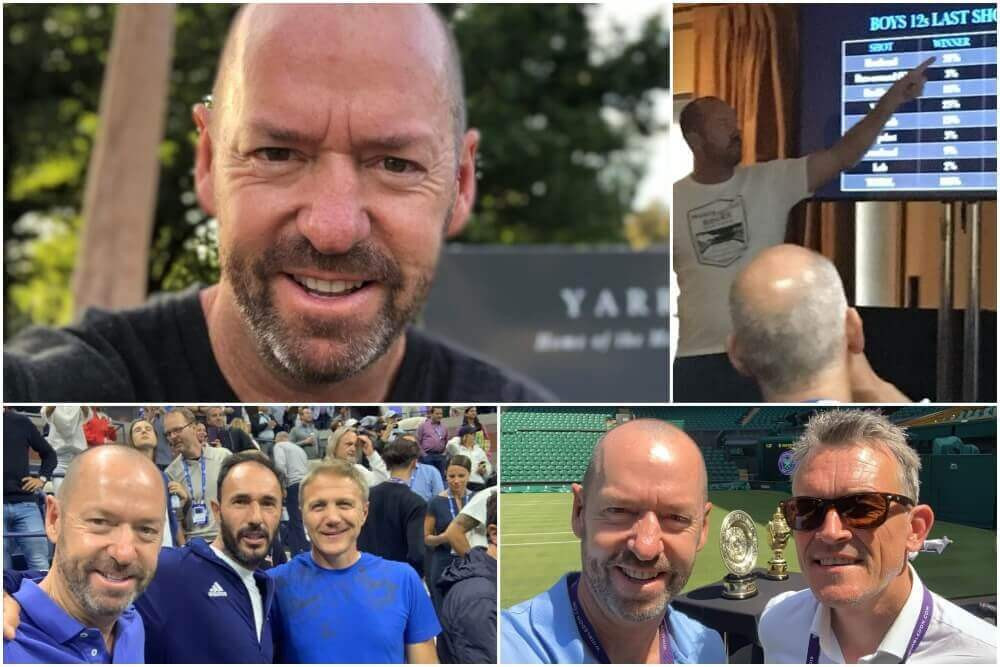
SportsEdTV: Good afternoon, everybody. We're here today with Craig O'Shannessy, who is a giant in the world of tennis data and analytics. Craig, welcome!
Craig O: It's an absolute pleasure to be here with you guys. Good to see you. Let's talk some tennis.
SportsEdTV: Excellent where are you talking to us from today?
Craig O: My home office here in Austin, Texas. Fortunately, in this environment, I'm still able to do a lot of work from home. I have a website and not so much work on the court these days, but a lot of writing for the ATP. A lot of research on my website. A lot of it is business as usual.
SportsEdTV: Excellent. Thank you for taking time out to speak with SportsEdTV today. Craig, I'd like to start out with a little bit about you. Can you give us your background about how you got started in the world of analytics and tennis?
Craig O: As a kid, I was very late to play tennis, I was probably thirteen when I started. I was playing Australian Rules Football before that and just found an old racquet in the back of my wardrobe at home with broken strings and an old ball and started hitting up against the side of the house. And I liked it. Then there was a little club, about a two-minute walk from my house with three courts right in the middle of an intersection. And I just went down there and started playing every day and really enjoyed it. I enjoyed the competitive nature. I practiced a lot with adults as well as other kids at the time. In Australia, tennis is a social glue. It brings people together. Everybody's playing tennis on a Saturday afternoon at our big club in town, we have twenty-five grass courts. So we would all congregate down there and there'd be just hundreds of people playing tennis. And I progressed through the ranks. I was not part of an academy or anything like that. I wish I had more emphasis on my strokes and my technique to clean them up. But I was playing four or five sets a night, seven nights a week for five or six years. So that probably directed me into the strategy side of tennis because I just would have to figure out opponents. I mean kids these days, how many sets do they play during the week in a practice environment? You know, quite often, maybe not enough. Maybe only a couple, whereas I was probably getting in thirty practice sets a week. So it was a different environment at a different time. But I know that it helped my analytical mind see the opponents, see the other side of the court, and quite often they were better players than I was. They had a better forehand and a better backhand, but I could still win if I could figure out their weaknesses and do a good enough job of hiding mine, which were plenty.
SportsEdTV: Well, that’s a perfect segue to our next question. I'd like you to describe for our listeners the world before computer technology in data analytics and the world now after computers.
Craig O: Well, official tennis statistics started in 1991 on the ATP Tour. There were people doing their own little thing before then, but official stats were published in 1991. So that's the year I graduated from college and stopped playing collegiate tennis. I played junior tennis before that, there was a lot of tennis that I played as a kid. And we had no match data. So, whatever part of the world you're in - I was growing up on grass courts in Australia - and then you've got the Spanish influence with clay courts. In Europe, everybody just guessed about data and what you should do in practice. You know, it must be good to hit a lot of balls in practice. So I remember working out with some guys that were pretty serious about tennis and at the time, we were just going out to hit crosscourt forehands for hours on end. And that's how we were going to get better and that's how we're going to start playing satellites and futures and all of that. And we just didn't know anything about the match data. We saw the match, we saw it and we played it. But now even, I ask questions to coaches like ‘what is the number one rally length in tennis? ‘And they're so wrong with the answer and they've been involved with tennis all their lives. They've watched it on TV. Played it as a kid. They've coached it all their lives. And they've got a million hours of tennis in. But when we ask them specific analytics from a match that we‘be covered, we now know they literally have no idea. So before computerized data, we were all guessing. We put the practice court first. We practiced in a variety of different ways. And we hoped that that would help us win more matches. Now, we can reverse that order and say this is what happens in a match and this is how you need to organize the practice. So, it was guesswork in the past. It was opinion, but that was all we had.
SportsEdTV: And how wrong were the guesses if you had to say?
Craig O: Horrific! There is one question I always ask and people are regularly 400% away from the right answer. And it's a real simple question, it's a real simple answer. It's essentially how often does this happen in tennis? And people will say something that happens around 7% of the time happens more than something that happens 30% of the time. And they’re convinced until I show them the match data. They have no idea.
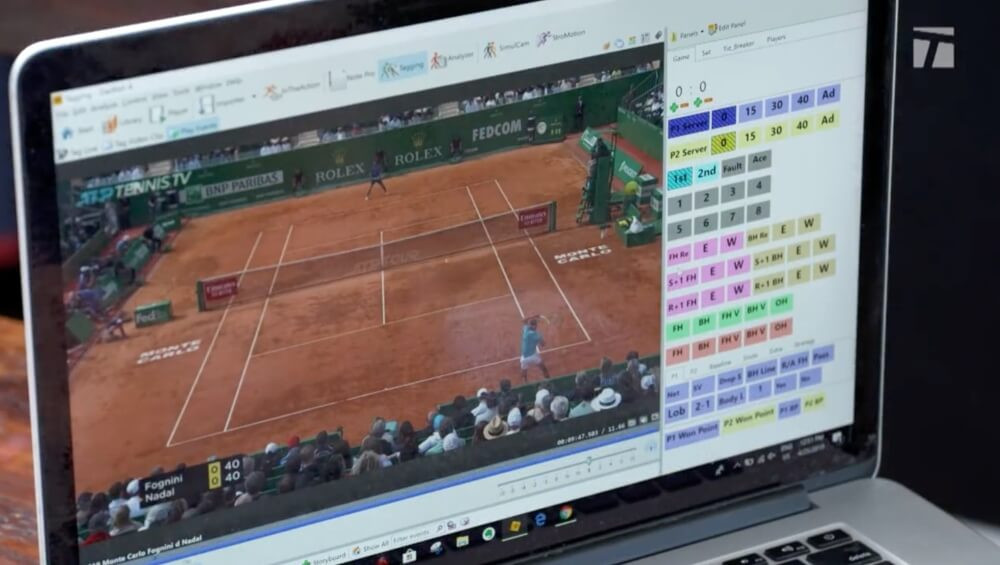
SportsEdTV: Amazing. It's pretty unbelievable. So what are the tools of the trade that you use to gather analytics?
Craig O: It's always been Dartfish for me. I was introduced to Dartfish as a young coach, and I wanted to initially look at strokes, forehands and backhands and backswings and follow-throughs. I was working at a club in Dallas at the time. A private lesson was $60 an hour. But you knew that if you did a semi-private lesson, it was $70. Okay. Well, I need to do more semi-private lessons. And then I got dartfish and I'm thinking, maybe I can charge $90 an hour for this. And it was great. The first thing I did when I videotaped somebody was to show them a good example. So let's say they've got a problem on their forehand and they're making late contact. I'd film ten forehands from the front, ten forehands from the side. I bring them straight to the side of the court and I'd say, okay, here's a good forehand. It didn’t matter whether it's a pro or anybody at the club that had clean, simple, repeatable technique on a forehand — I’d show the student what good technique looks like. So the first thing to do is train their eye to understand what works and what is simple and what should be analyzed. And then I'm like, okay, now look at yours. And then I just sit back and be quiet and they go, oh my goodness, look at this. This is wrong and this is wrong and this is wrong. And I'm like, yeah, you're right. So I learned that early on using Dartfish that you don't show them their strokes first because they don't know what they're looking at. They don't know what's wrong. Right. So you video them before you tell them what's wrong and why. They're like tell me what's wrong and why. I'm not going to tell you a thing until I show you. And then I showed them the good one first and I showed their stroke. And then we'll get to work on it. About halfway through the lesson, they'll hit it really well. We come back and then we go side-by-side. Then you sink the ball contact and show this is where you started thirty minutes ago and here's where you are now and you see the obvious improvement. So with that technique, I did a lot of lessons in Dartfish at the club and then started branching out. Dartfish came out in maybe 2004, 2005 with match tagging and that was when things really took off for me, the ability to tag a match and say I only want to see forced errors. I only want to see backhand winners. And instead of looking at the match chronologically, you can look at it by patterns of play. And that was everything for me. That's when my mind and my business and everything kind of took off in a different direction.
SportsEdTV: That's when the rest of us were still guessing. Way before the technology became available. We were looking at the wrong things. What are three or four of the biggest insights that tour players need to know that you've learned from data that will help them improve across the board?
Craig O: From the beginning of time to 2015, we've sat on the side of the court and - remember that stats started in 1991- started to have a clue. So the primitive data was first serve percentage, points won on second serve, double faults, aces, unforced errors. That was it. That was it! So we sat on the side of the court and watched a match and we're trying to figure out as coaches what was important, what do we need to tell our player after the match to help them improve? And all we got then was: "it's all about the forehand" or "it's all about the serve" or "it's all about your net points". And we sat there, we watched these points and we never had the idea to think, well, that was a short point. Let's count those. That was a medium length point. Let's count those. It's never clicked in our mind to group together points by the length of the rally. We've looked at it every other way possible except for that.
So in 2015, I'm at the Australian Open. I'm sitting with my computer and I've got my screen in front of me. And IBM has all their data. I'm sitting in a media terminal and I look up and for the very first time I see they've cut up rally lengths into three different segments, 0-4 shots, 5-8 and 9 plus. Now, they put shots in there, which is misleading because of the way they looked at the length of a rally. It's was by the ball landing in the court, it's not the ball hitting the strings. So, I served to you, you returned to me. I hit winner. Rally length of 3. I served to you, you returned to me. I make an error rally lenght of 2 because only two balls landed in. So after that tournament, I put it all together and I figured out the breakdown was: for the men, 70% of all points were in 0-4 shots, 0 being a double fault, 20% in 5-8 and 10% 9 plus. So I look and it was 70% of points, 7 points out of 10, these players are only hitting the ball in the court a maximum of 2 times each time. There are so many short points. Than I look at the long rallies of 9 plus, a double-digit rally, and they're only happening 10% of the time. So I said our practice court doesn't reflect this at all. I understand we must have repetition to improve. I understand that. I understand if I'm to improve my forehand, I've got to hit it a lot. But if we're doing patterns of play, we've got to understand that it's the serve, the return, the serve plus 1, that's what needs more development. So that's number one thing - pros need to understand that. Number two is that the most common rally length in tennis is 1 shot. So I mentioned this earlier, 30 percent of all points in tennis are 1 shot. People think it's 4, which is about 7%. So they want to go out and practice all these long rallies, but a twelve shot rally happens like 1.2% of the time... Who cares?! So you show them these graphs and charts, these bar charts that start at a rally length of 1 shot at 30% and then the percentages quickly go down from there.
The way a point behaves in practice is like a sound wave. And we crave that as a coach and sound waves oscillate the same way consistently. So it just oscillates the same into eternity. It’s doing the same thing again and again, up and down, up and down. But that's not how a point in tennis is played. It's more like a shockwave, like an earthquake. So you get this big bang, so you get this huge shock and then it quickly dissipates. So in practice, we crave regular oscillation, but in a match it's bang, and then it's gone. Shockwave. So people will say: "Coach why am I so good in practice, but I can't win a match"? It's because you're so good at the repetition side of it. But that doesn't happen in matches when you included a serve and a return. And then lastly, as I looked at the data with each of those rally wins, which ones do the match winners do best at? And essentially a match winner will win a 0-4 rally length points 90% of the time, but a match winner will win the 9 plus rally length points only about 55% of the time. So it shows you that winning happens early in a point. Essentially, when you boil it all down, the first two times you touch the ball in a rally mean more than anything else that follows.
SportsEdTV: Very interesting. Practices still don't resemble anything to do with what you just said.
Craig O: I completely agree. Completely agree. And even in today's game, when you look at them as mutually exclusive (practice vs matches) you think we're going to do drills because we need to work on our forehand or backhand or we’re going to play matches. But you're still working on your forehand and backhand when you're playing sets. But you're working on them in a competitive environment with the reality of difficult balls. It's better to do it that way. So, yeah, with how countries and the tennis fraternity have practiced, it's always been very, very similar.
SportsEdTV: What's really interesting about those statistics, Craig, is that I remember 25 or 30 years ago when we were all serve and volleyers that played one or two-shot points as the average, people used to say I can’t watch all this one and two-shot tennis. It’s too boring. But they don't realize today, even though most points are played from the baseline, the points are just as short.
Craig O: Yeah, exactly. You know, with Novak Djokovic, I worked with him for three years when he won two Wimbledon titles. We talked all the time. I said Novak, when you play one long point and the crowd goes nuts, they're happy. But we don't care. We don't care. Your winning is done early in the points. The first two times you touch the ball is when you win titles.
SportsEdTV: So Craig. Which players benefit the most from data analytics today on the men's tour, the women's tour? Are there any players who really get this? You mentioned Novak. Who else has really used data to improve their results dramatically?
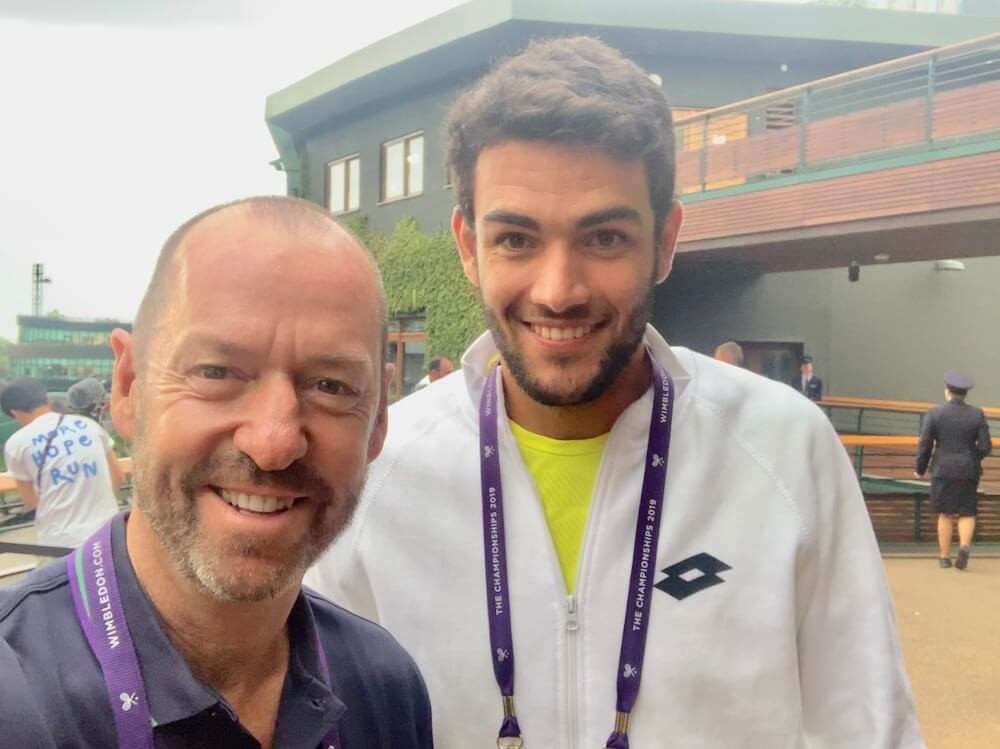
Craig O: For a few years I've been the strategy consultant for the Italian Tennis Federation. I do seminars with high-performance coaches that teach their elite juniors and their up and coming players. And the federation saw the work I did with Novak and asked, we've got this guy over here, he's up and coming. He's outside the top fifty at the moment. We like him. Can you help out? So I said sure. So the guy was Matteo Berrettini and his coach, Vincenzo Santopadre and the head of men's tennis, Umberto Rianna. Just amazing guys. And Italian tennis is all in with analytics. They're all in. We helped take Matteo from 56 to 8 in the rankings in one season. A huge part of that was just the culture of the entire country, the entire federation saying that we're in with Craig, whatever Craig talks to you about when we go around the country, we're all in because that's the next wave of tennis. It’s all about the analytics. So that laid the groundwork and everything that I would do with Matteo. And again, it's not just pure analytics, it's that the analytics tell you which strategies are right. They had not done a lot of competitor analysis before I started working with them. They didn't have the numbers to back it up so they would ask me ‘Craig, we've got Zverev in Rome, we've got Pouille in Rome, we've got this guy somewhere else. Do you have the strategy for them?’. I’d say, yeah, here it is.
So they went from being a little bit more focused on Matteo to being a lot more focused on the person on the other side of the net and the analytics drove that. So Matteo would go out there on the court deeply knowing the strengths and weaknesses of the opponent and plugging in his game to capitalize on that. So, you know, the big run to the semifinals of the U.S. Open last year was all predicated on a lot of work behind the scenes on understanding the opponents, understanding how Matteo fit into their patterns. At the beginning of the run I think he was about eighty in the world and I did a comparison against Novak. I said Matteo, essentially everything from your serve games, every data point -I'm talking 60 datapoints- lined up the serving side of Novak’s data. When Matteo was sixty in the world, he was not far off from Novak, who was at number one, and sometimes better. But I told him you're not far off on serve games. Now, you take all the returning data. Now, you're not even in the same county as Novak. So instead of going out there just working the serve, you need to work on your return. So you need to have return patterns. You need to have targets. We need to get the return side going because it's not nearly as good as Novak’s return game. So that was also a big wakeup call for the coaches to say we've got talent here. But where are we going to spend our time on the practice court? And they turned what was a somewhat weaker part of the equation certainly into a strength for Matteo.
SportsEdTV: Very fascinating. That's a great story. What about on the coaching side, which coaches everyone embraced analytics. I'm sure you get calls all the time from coaches. Are there any that really see the importance of data a little more than others?
Craig O: Yeah, a German coach named Jan De Witt. He is an amazing guy, a great tennis mind. He’s coaching Basilashvili now. Whenever we're at tournaments, we're always comparing notes. And, you know, as a coaching fraternity, I can't wait to get to these tournaments and see these coaches. I'm like, hey, I've got something new I want to show you. It's it's really a great cooperative environment. This group of coaches that are very much into analytics, they're rivals - they’re coaching another player. I'm like, you know, my guy might play your guy in three days. We don't care. We want to drive analytics. We want to share analytics. We want to compare notes. We can't get to the way to get to the tournaments and show somebody that another coach that appreciates this, our new data, and share it and get a new insight into it. So you that sharing is a really big reason why it's taking off at the moment. It's not an environment at all where we're being quiet and we're guarding it. It's actually quite the opposite. Infosys provides the ATP with their data and they've done an amazing job at getting new data out there. I write a weekly column on the ATP website called Infosys Beyond The Numbers. It's almost every week I'm writing something you've never ever seen in our sport before. It's brand new data. So that's really helping to open up our sport and provide information for coaches at all levels of the game.
SportsEdTV: We're talking a lot about the pro game, but most of our viewers on SportsEdTV are not pros. They are amateur players, their parents and coaches. What would you advise them to do in the area of using data? What resources should they go to and how would they approach using it at a very early stage of their development?
Craig O: There's two different things. First, they need to understand what data is useful in tennis, and which analytics matter most. Also, whether you're a coach or a parent, how do I help my specific player? So down this road, you have free content everywhere. If you go to the ATP website and click stats, there are three or four-hundred stories that I've written that you can read for free. Each one of them basically is brand new data on our sport. On my website, I have a blog that's got a lot of free information. And I also keep a record of all of those Infosys reports.
SportsEdTV: Tell us about your website.
Craig O: Yes, my website is braingametennis.com. There is a paid area. I have ten core areas on there where I dig deeply into specific areas of singles, doubles and the mental game. But there's a free area as well, with the blogs and with everything that I'm writing for Infosys. So with just those two resources, you‘ve got months and months of reading and videos to see. I post every day. I posted this morning. I'm the analyst for the Wimbledon Channel. I do these little seven or eight minute hits on the Wimbledon Channel. I'm posting them on my website as well. So you've got so much free information there.
The second thing to do is to start taking simple stats of your players, whether it's on an app, on the phone, Dartfish or just pen and paper. Let's start looking at some analytics, start looking at rally length. There was a 3 shot rally. Write it down. It was a 5 shot rally. Write it down. That was a 1 shot rally. Maybe grouping together into the categories I mentioned earlier. You don't what's going to happen until you look at the analytics afterwards. And I have sat on the side of the court and watched thousands of matches. And your eyes lie to you. I’m thinking, I think this was the most important thing in match - then you look at the analytics and you might find out that this over here happened instead and you didn't even realize it. So just starting with basic stuff, pen and paper or using apps is a really good way to do it. Every Saturday and Sunday, these tournaments are everywhere, even at the moment, we've got some UTR tournaments out there. So starting simple is the best way to understand where it's being driven and understand what you can start with.
SportsEdTV: OK. Last question, what is the future of analytics and tennis? What is on the horizon? Give us a little glimpse of the future.
Craig O: Well, it's going to be giving the ability to have data on specific patterns of play and specific moments in time. So you're going to say, it's 3-all 30-40. My best play is to serve there, the ball is going to come here and I'm going to go there. So, for example, just look at forehands. Let's say Roger Federer plays a match and at the moment we have this analytics data where we record his forehand winners. He's got forty. He's got forty forehand winners in this long five-set match at Wimbledon. So at the moment, that would just get the number forty. But somewhere, and it might be a huge core where maybe twenty-five of the winners all happen the same, but we don't know that. So you start cutting it up and say, OK, if you look at the forty winners, was he serving at the start? Maybe the point is a return? So what you’re going to find is he was serving on thirty of them, he was returning on ten. And so then you look when he was serving, the rally length was 3. So the serve went in and return went in and then the forehand winner happened. This Probably happened on twenty-five of the thirty. So the ability now to say, OK, this is what I do best. This is what happens the most. And when I serve here, I get the ball here, which enables me to go over there. So when you can find twenty-five of the forty winners that are absolutely identical, then you can infuse that into the match, you're making life simple for the players.
You know, one of the things with Novak was that he's got two decisions: is this a forehand or backhand? Do I crosscourt or down the line? Do I go to the net or stay back? He may have five or six options, but essentially I can boil it down to two big ones. What data analytics is meant for is to help us win more matches. To help us win more matches, you boil that down before the point starts, to help the player make the right decision or during the point, they recognize the situation and plan accordingly. And they think "This is the high percentage play and I'm going to gravitate towards that rather than another option". So I think our players will become smarter. I think the quality of our tennis will rise. We will know to put more balls in early in the point. The rally lengths will naturally get a little bit longer. But maybe not by much, maybe by half a shot. But I think it will help develop the overall quality of our game and it will keep more kids in the sport because they will understand in tennis, the #1 player in the world wins only 55% of all points, which means they lose 45% of all points. Forty-five points out of one-hundred! Quite okay. In fact, it's a great day at the office. The kids these days say I lost a point. I'm sad. I win a point. I'm happy. This data will give them the perspective to understand it’s okay and expected to lose a point. In fact, they have permission to miss shots and they are giving the opponent a quota to win forty-five points out of every hundred and it's a goal mindfully.
SportsEdTV: And I think it can make tennis more interesting to viewers if these analytics were available to the broadcasters.
Craig O: I couldn't agree more. And imagine a person sitting and watching on TV thinking ’you need to serve out wide right now’. And the player goes down the tee. What are you doing? What did you do? So that engagement will be good.
SportsEdTV: It's very exciting. Data is important in every part of our lives. It has been very enlightening to talk with you. Thank you so much for spending time with us. We look forward to seeing your content coming to SportsEdTV in the future.
By clicking on the video below, you can listen to the whole interview.